Project or Shell Cash Flow Properties (Curves Pane)
As shown in the screen capture below, the Cash Flow Properties window Curves pane contains the Curves drop-down list, which lets you add or remove curves.
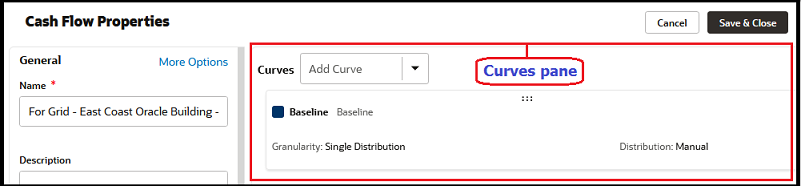
After you add a curve, the system adds an interactive image representation of the added curve to the Curves pane.
The following explains the elements of the Curves pane.
Curves
Click the Curves drop-down list to open a list that contains the list of available curves.
These curves, or data sources, have been defined by the Administrator in the Standards & Libraries module. (Go to the Company Workspace tab and switch to Admin mode; in the left Navigator, select Standards & Libraries, then select Cash Flow, and then select Data Sources.)
The Cashflow Datasources window, where the Administrator edits the list of data sources, contains a list of data sources that are categorized by name, curve type and color. For example, the name of a data source can be Actuals which is assigned to a Spends curve type, or the name of a data source can be Original Budget which is assigned to a Portfolio Budget curve type.
Different names can be assigned to on curve type. That is to state, depending on the curve type, the curve setup options will differ. The admin can define one curve for every data source.
For more information, see the Unifier Essentials Modules Administration Guide.
Note: The Portfolio Budget curve is linked to scenarios in the Portfolio Manager. The Project Manager must create this curve. After it is created, the curve shows the initial budget projections.
The list of available curves include:
- Baseline curve
- Actual (Spends) curve
- Forecast curve
- Derived curve
- Portfolio Budget curve
- Custom curve
When you open a curve, you can view the data in the transaction currency, if the transaction currency is different than the project currency.
If a curve, or data source, is available within the Curves pane (interactive image representation of the added curve), double-click anywhere on the image to open the curve window. In this window, you can see the curve type information as well as information related to the curve, as described in the following table. If you make any changes, click Update to save your changes; otherwise, click Cancel to discard your changes or close the window.
Curve Type | Description |
|---|---|
Granularity |
|
Distribution Method |
|
Select change orders you want to include |
|
Variance | Your options are Inflow or Outflow. See the following topics for details about Variance values. |
To add a curve:
- Click the Curves drop-down list.
- Select a data source, or curve, from the list (for example, select Forecast) to open the data source window.
- Enter values in the fields and click Add, when finished.
Last Published Monday, April 14, 2025