Unifier Essentials 23.1
Reports
Quarterly Cash Flow Report Template
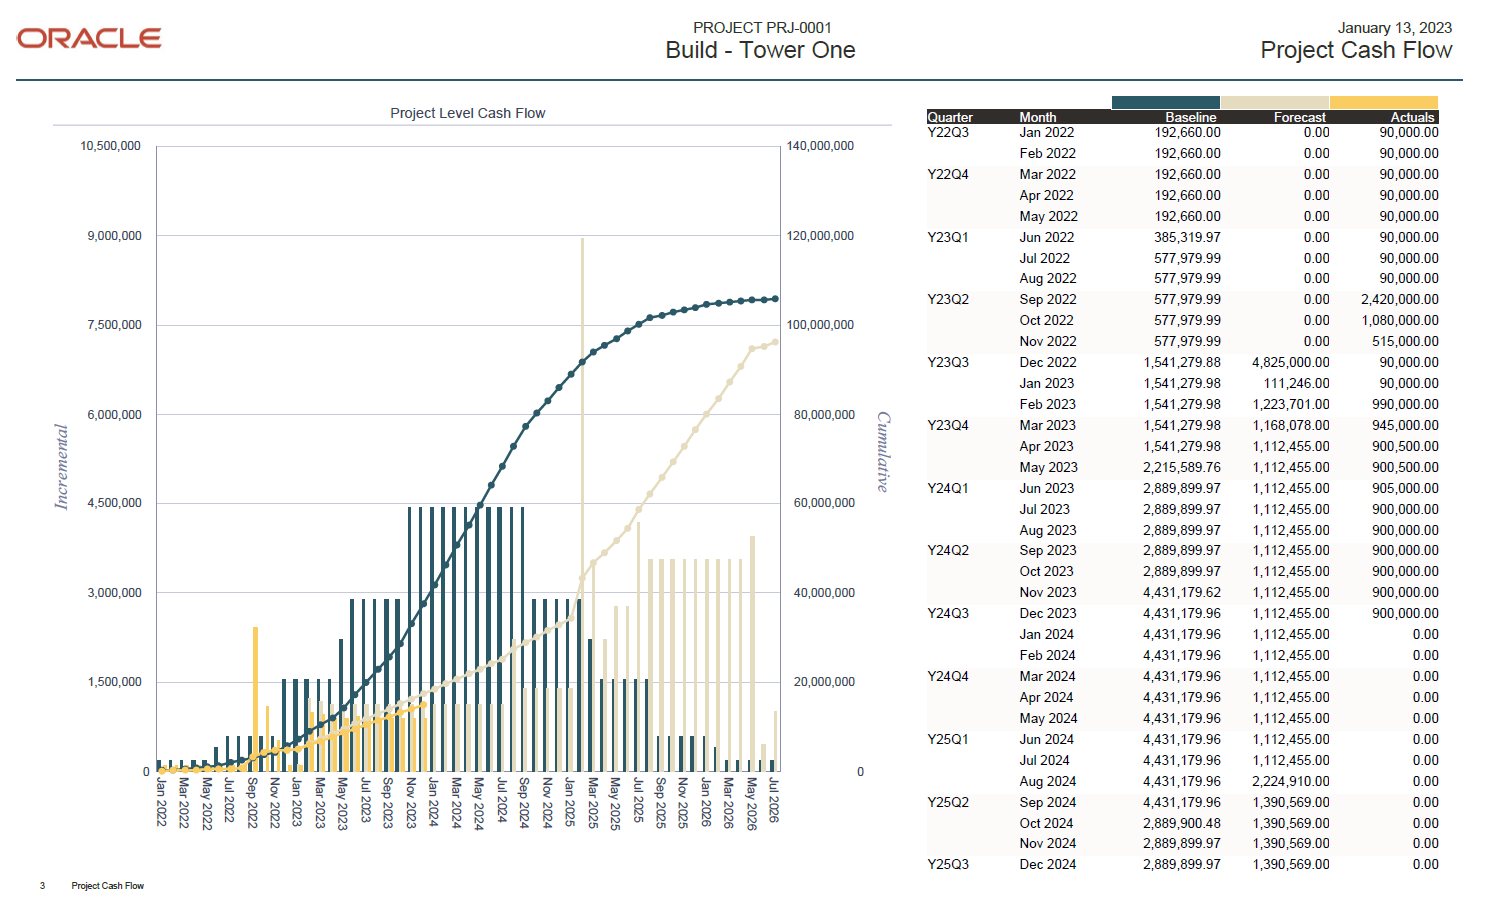
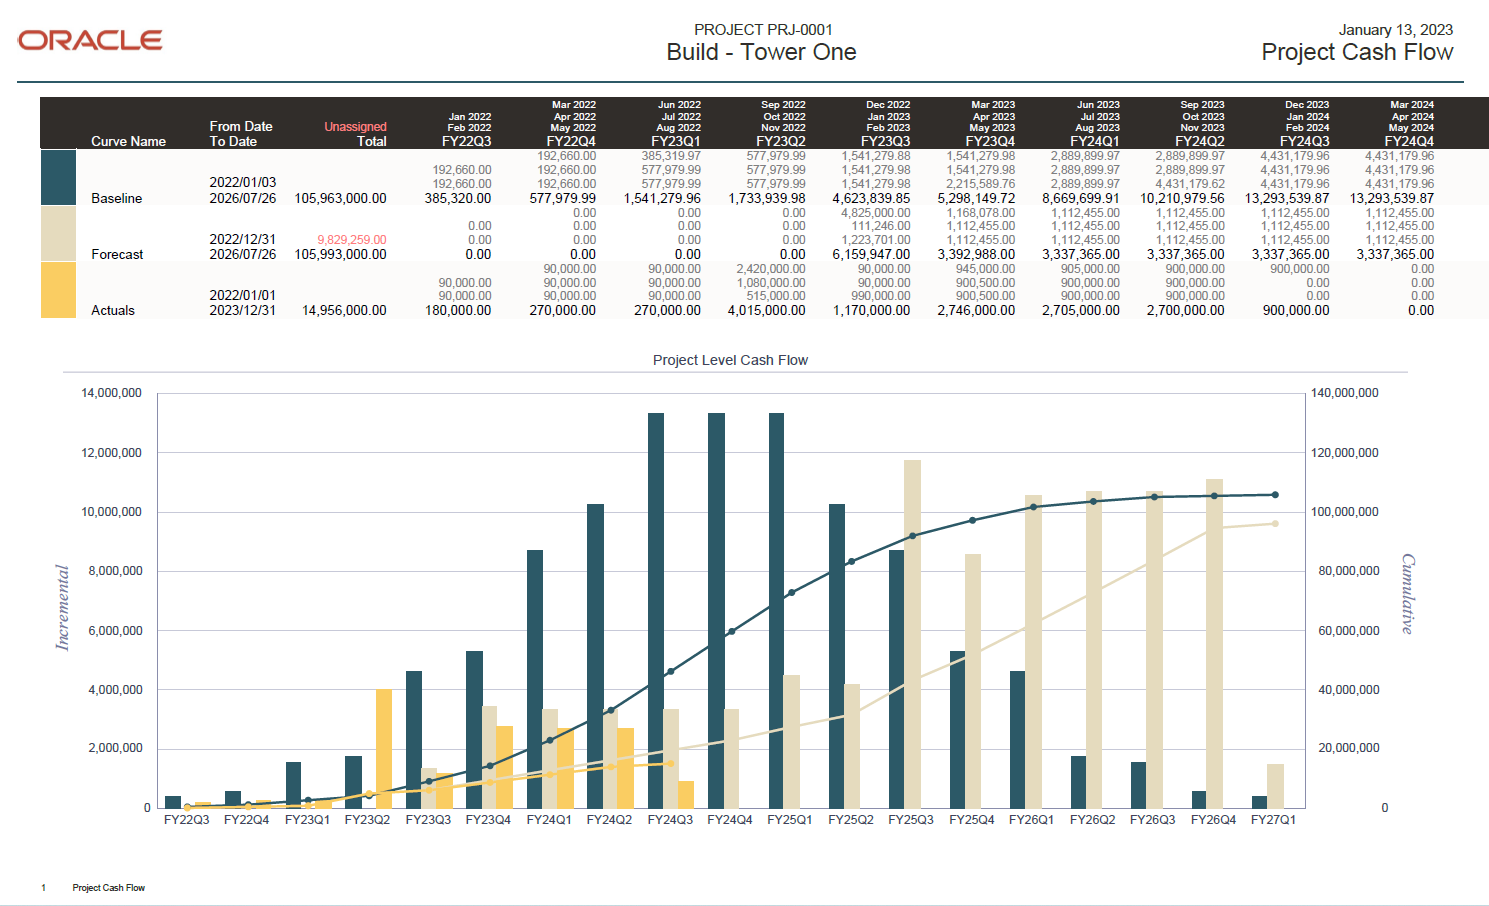
A Quarterly Summary template that shows monthly cash flows with summarized amounts by quarter has been added to Cash Flow Report at the project level. There are two graphs on the report, one for quarterly amounts and the other for monthly amounts. Both show incremental bars and cumulative curves.
The start month for Q1 can be adjusted by adding a Standard Planning Period in Standards and Libraries / Period Structure that must be named UE Custom Report Period Structure.
This is a new template for an existing custom report so it is automatically available. There is no need to update the shell navigator or access control.
Last Published Tuesday, November 21, 2023