Dashboards
Release 23.6
New Project Summary Dashboards
New dashboards are added in three categories: Vendor Management, Change Management, and Contingency.
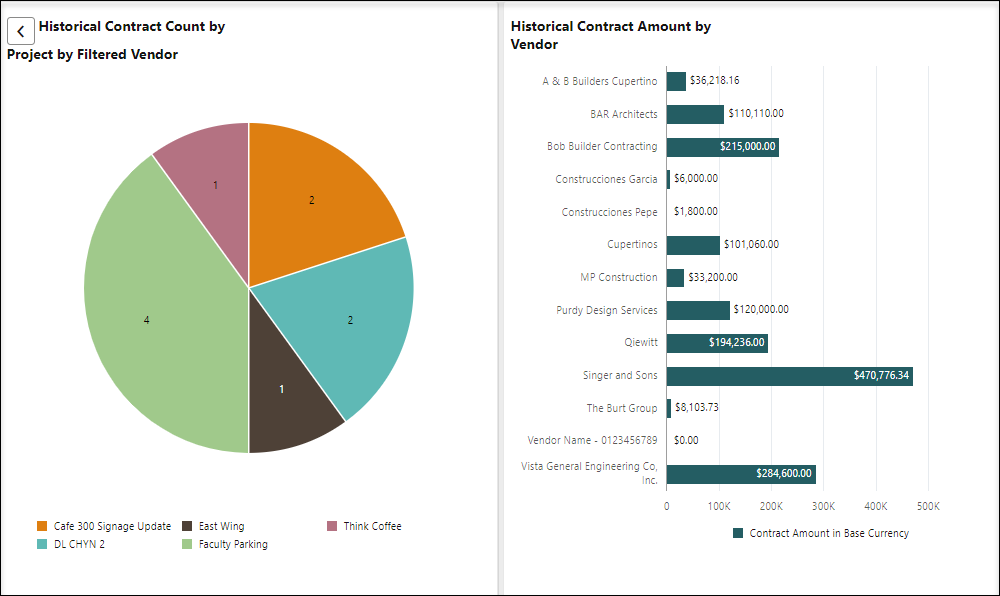
- Vendor Management
- Historical Contract Count by Vendor
- Historical Contract Amount by Vendor
- Active Contract Count by Vendor
- Active Contract Amount by Vendor
- Historical Change Order Count by Vendor
- Historical Change Order Amount by Vendor
- Active Contract Change Order Count by Vendor
- Active Contract Change Order Amount by Vendor
- Historical Average RFI Turnaround Time by Vendor
- Historical RFI Count by Vendor
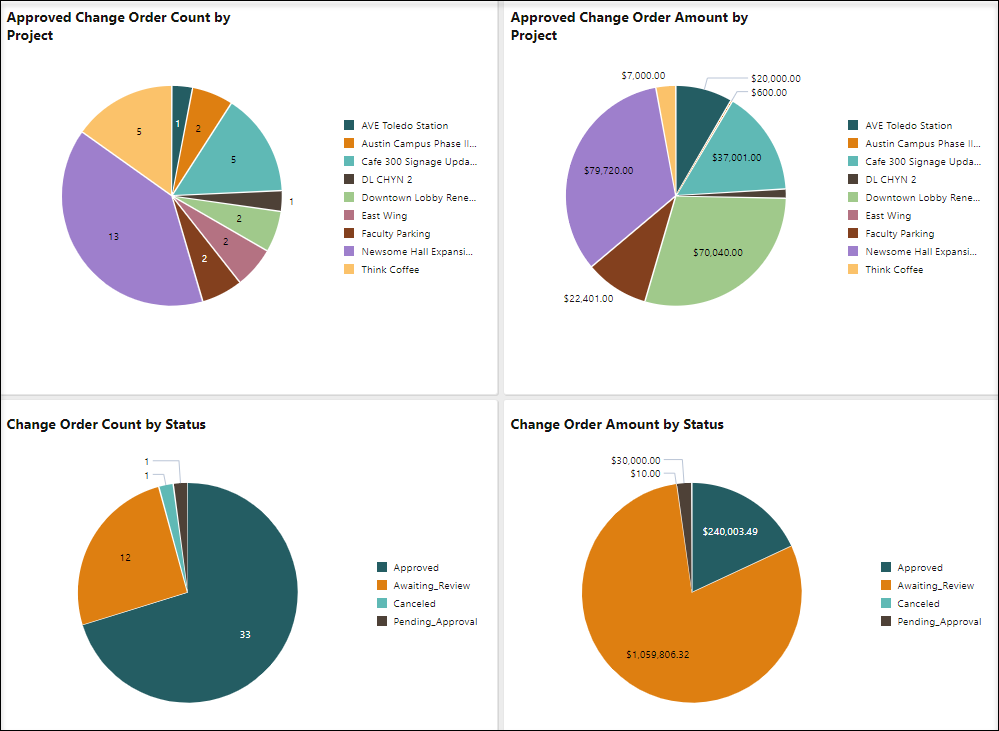
- Change Management
- Approved Change Order Count by Project
- Approved Change Order Amount by Project
- Change Order Count by Status
- Change Order Amount by Status
- Change Order Count by Reason
- Change Order Amount by Reason
- Pending and Approved Change Request Line Item Amounts not added to Change Orders
- Commitment Changes as a Percentage of Committed Cost by Project
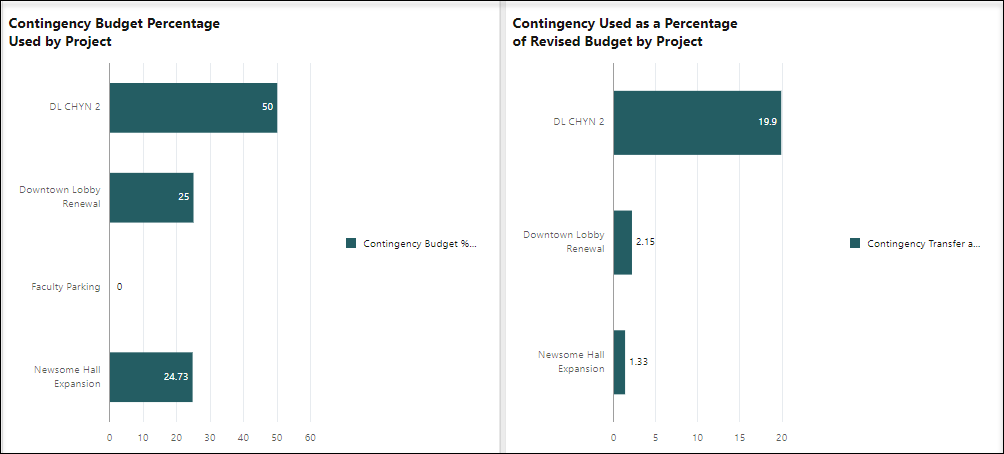
- Contingency
- Contingency Budget Amount Used by Project
- Contingency Budget Amount Available By Project
- Contingency Budget Amount Used by Reason
- Contingency Budget Percentage Used by Project
- Contingency Used as a Percentage of Revised Budget by Project
Release 23.3
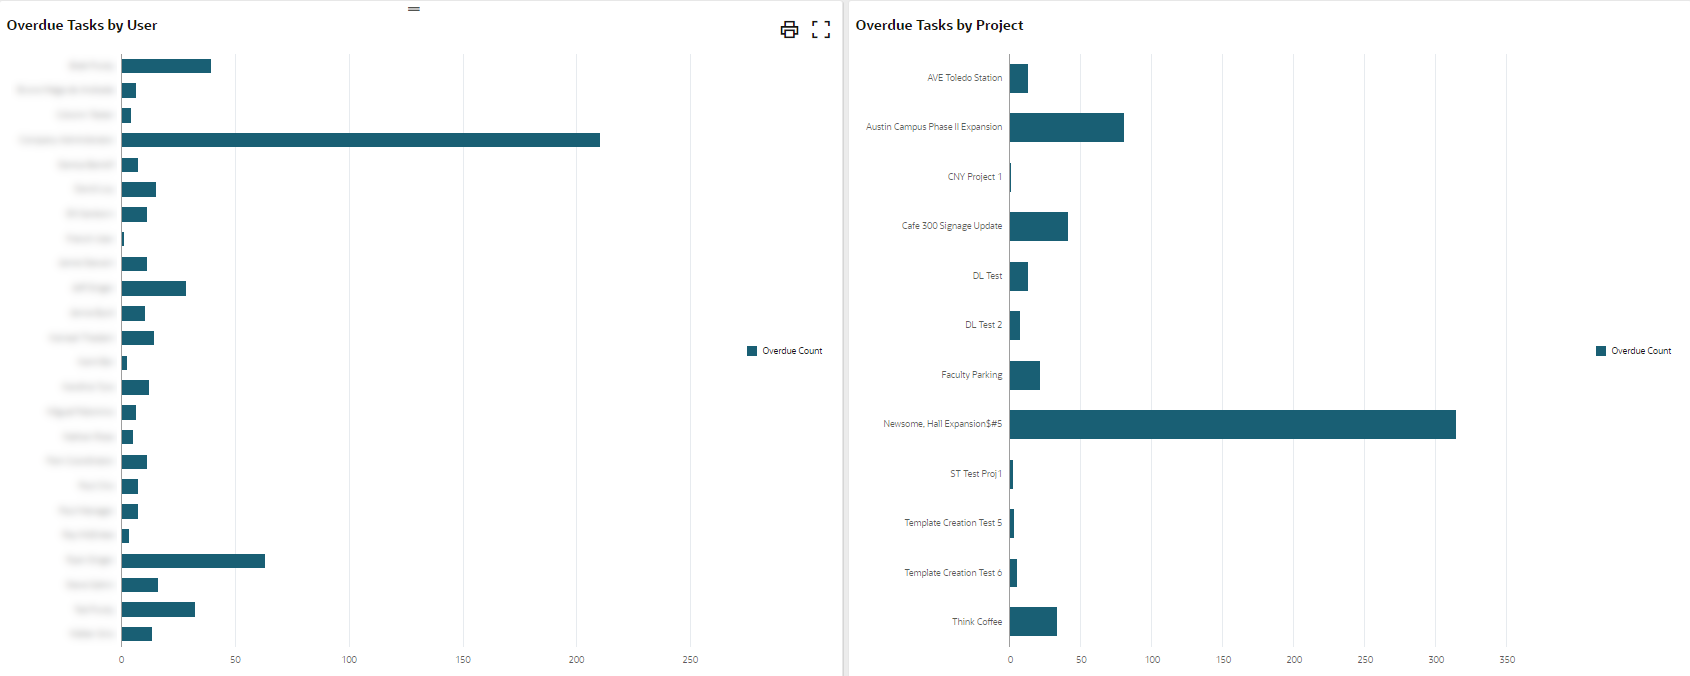
Dashboard Blocks for Overdue Tasks
Two new dashboard blocks are added to the Organization and Test shell Project Summary - Open and Overdue Tasks dashboards:
- Overdue Tasks by User
- Overdue Tasks by Project
Customers can configure these dashboards by using the Overdue Tasks data cube.
Release 23.2
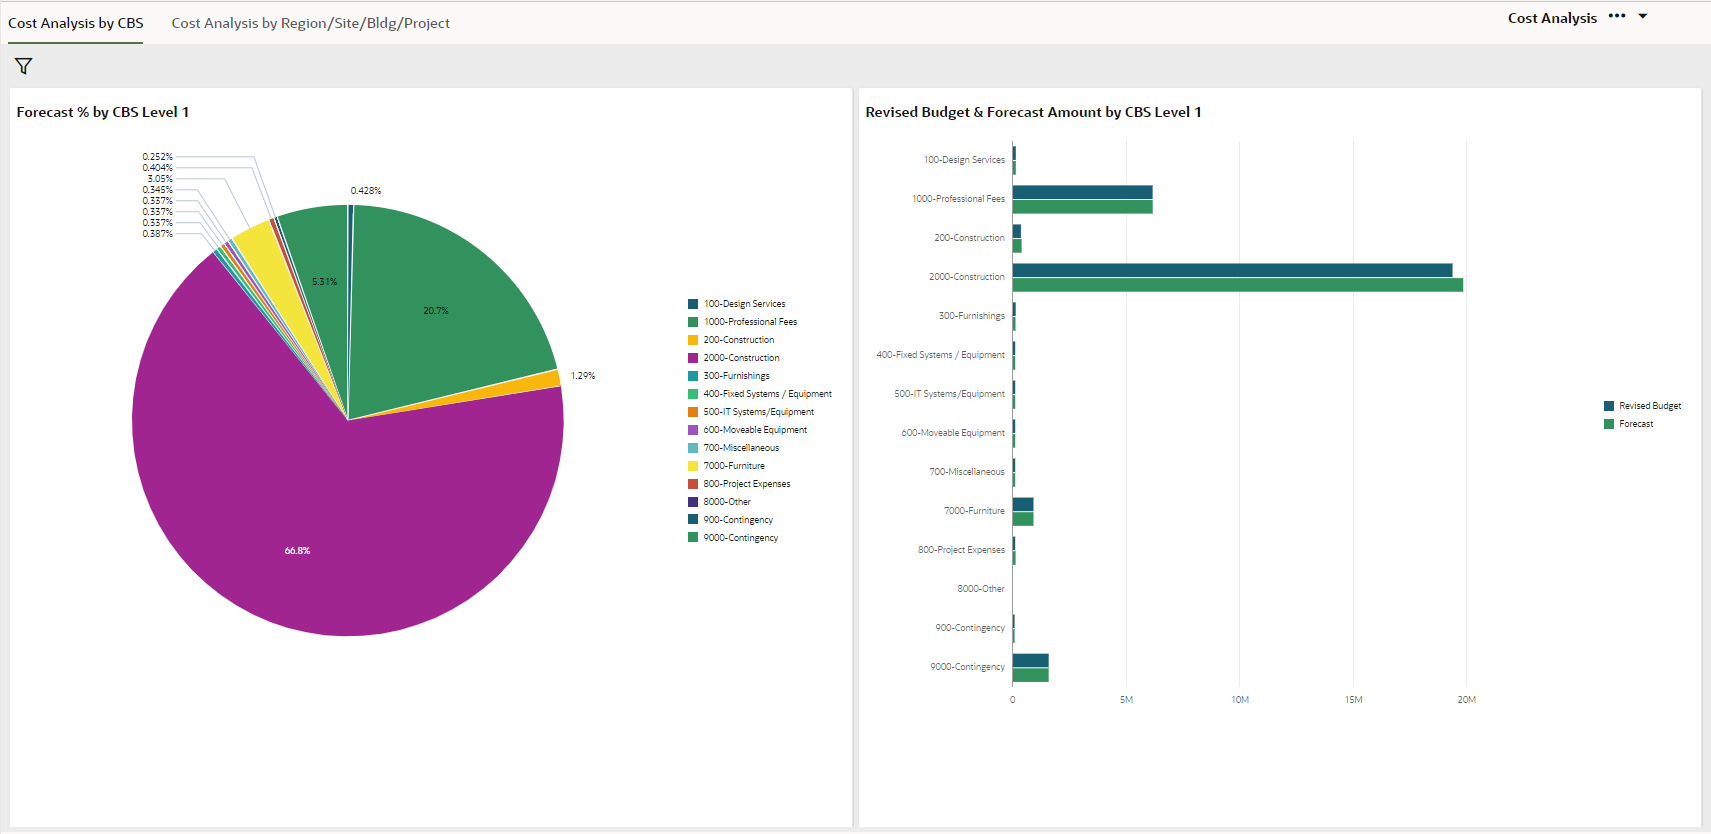
Cost Analysis Dashboard
A new Cost Analysis dashboard with two tabs is now available at the organization shell level. The first tab provides cross-project analysis by CBS; the other is for cross-project analysis by cost category.

Last Published Tuesday, November 21, 2023