Different Methods to Add Data
You can use different methods to add data from the Data Panel to create or update visualizations on a canvas.
Area | Description |
|---|---|
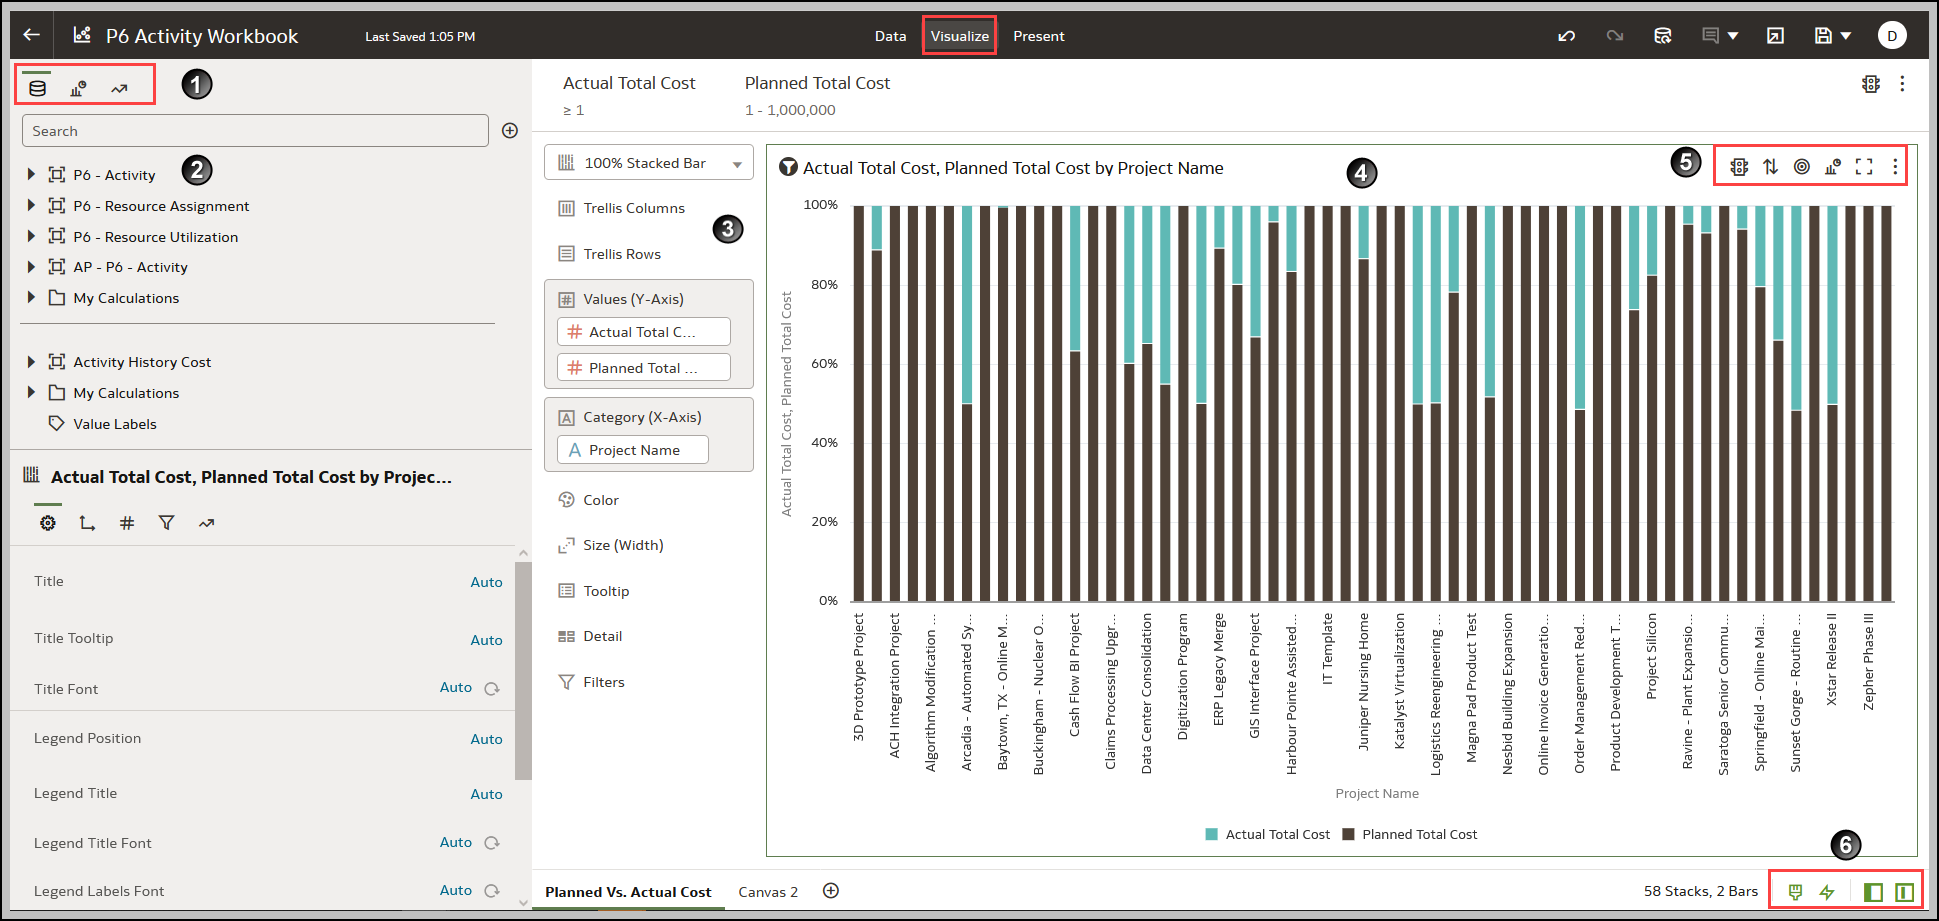
1 | The Data Panel on the left contains three tabs:
|
2 | Data tab of the Data Panel. |
3 | Grammar Panel |
4 | Visualize Canvas |
5 | Click the relevant icon to perform the following actions:
|
6 | Toggle Panel to perform the following actions:
|
Use one of the following methods to add data from the Data Panel:
- Drag data elements from the Data Panel and drop them onto the canvas.
- Select a data element or use Shift-click or Ctrl-click to select multiple data elements in the Data Panel, then right-click to select either a particular visualization type or the option to create a visualization automatically.
- Double-click a data element or use Shift-click or Ctrl-click to select multiple data elements in the Data Panel, then right-click to add them to the canvas.
When you update an existing visualization, you can add data from the Data Panel onto the Grammar Panel or Assignments Pane on the canvas. You can move the data elements from one area to another in the Grammar Panel or Assignments Pane. The visualization is updated based on your selection.
You can create a visualization by selecting a visualization type from the Visualization tab of the Data Panel and adding data elements to the canvas.
Last Published Friday, December 8, 2023