Adding Reference Lines to Visualizations
You can use advanced analytics reference lines to identify the range of data element values in a visualization.
- On the Home page, select a workbook, click the Actions menu, and then select Open.
- Confirm that you’re working in the Visualize canvas.
- In the Data Panel, click the Analytics
 icon.
icon. - Drag and drop Reference Line into a visualization. Alternatively, you can double-click Reference Line to add it to the selected visualization.
- In the Properties pane select the Analytics tab.
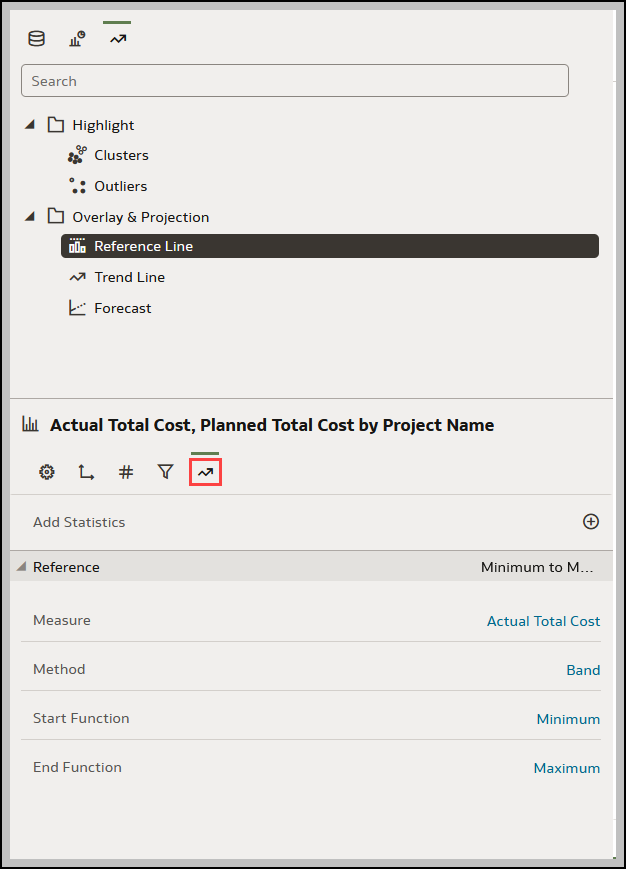
- In the Method row, click the value to select Line or Band.
- Click the current reference Function and select the function you want to use.
- When you choose the Line method, select a reference function and enter the appropriate values as required.
- When you choose the Band method, select one or more reference functions, and enter appropriate values if required.
- Click Save.
Based on the selected Method or reference Function, a line is displayed in the visualization to highlight the value.
Related Topics
Last Published Friday, December 8, 2023