Blending Datasets
If your workbook contains multiple datasets, then you can blend data in one dataset with data in another dataset.
When you add more than one dataset to a workbook, the system tries to find matches for the data that’s added. It automatically matches external dimensions where they share a common name and have a compatible data type with attributes in the existing dataset. Blending relationships are stored in the tables and not in the workbook. So any blending matches that you add or remove affects the other datasets that use the same tables.
Note:Datasets can include tables from different connections and schemas. These datasets use joins, which are defined in the Dataset editor. To reduce or eliminate blending in workbooks, Oracle suggests that whenever possible you create datasets that contain multiple tables and use joins.
- On the Home page, select a workbook, click the Actions menu, and then select Open.
- To add another dataset to the workbook, then click Data, and in the Data page, go to the Data Panel, click Add (+), and then Add Dataset.
- In the Add Dataset dialog, select a dataset and click Add to Workbook.
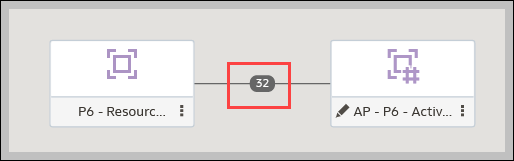
- In the Data page, go to the Data Diagram and locate the datasets to blend.
- Click the number between the dataset icons.
- Optional: To change the match for a column, click the name of the column and select a different column.
If columns have the same name and same data type, then they’re recognized as a possible match. You can customize this and specify that one column matches another by explicitly selecting it even if its name isn’t the same. You can select only those columns with a matching data type.
- Optional: Click Add Another Match, and in the table, select the columns that you want to join.
- Optional: For a measure that you’re uploading for the first time, specify the aggregation type such as Sum or Average.
- Click OK.
Related Topics
Last Published Friday, December 8, 2023