Connecting a Note to Data Points in a Visualization
Add connectors to a note to identify specific data points in a visualization.
You can connect a note to up to ten data points on a visualization or canvas. You can’t connect a note to a data point on these visualization types:
- Chord Diagram
- Correlation Matrix
- List
- Map
- Parallel Coordinates
- Tile
By default, a note's data point connectors are displayed, but you can hide them. See Showing or Hiding a Note's Data Point Connectors.
- On the Home page, select a workbook, click the Actions menu, and then select Open.
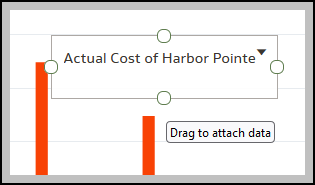
- Locate and hover over the note that you want to attach to data points. Click and hold a circle and drag the line to the data point that you want to connect the note to. You can connect a circle to multiple data points.
- Click Save.
Related Topics
Last Published Friday, December 8, 2023