Cost Overview Project
Description: This project gives an Executive/PMO insights on how the organization is tracking its budgeted cost and where most of the cost/work is going to happen. This helps them focus on the key portfolios and gather how they are performing to cost. In case there are outliers, the users can take pre-emptive corrective actions.
Number of Canvases: 1
Default Canvas: Cost KPI’s Global Outlook
Canvas/Dashboard Name: Cost KPI’s Global Outlook
Data Source(s): P6 EPPM, Unifier
Subject Areas: P6-Project History, P6-Activity, P6-Resource Utilization, and Unifier-Cash Flow
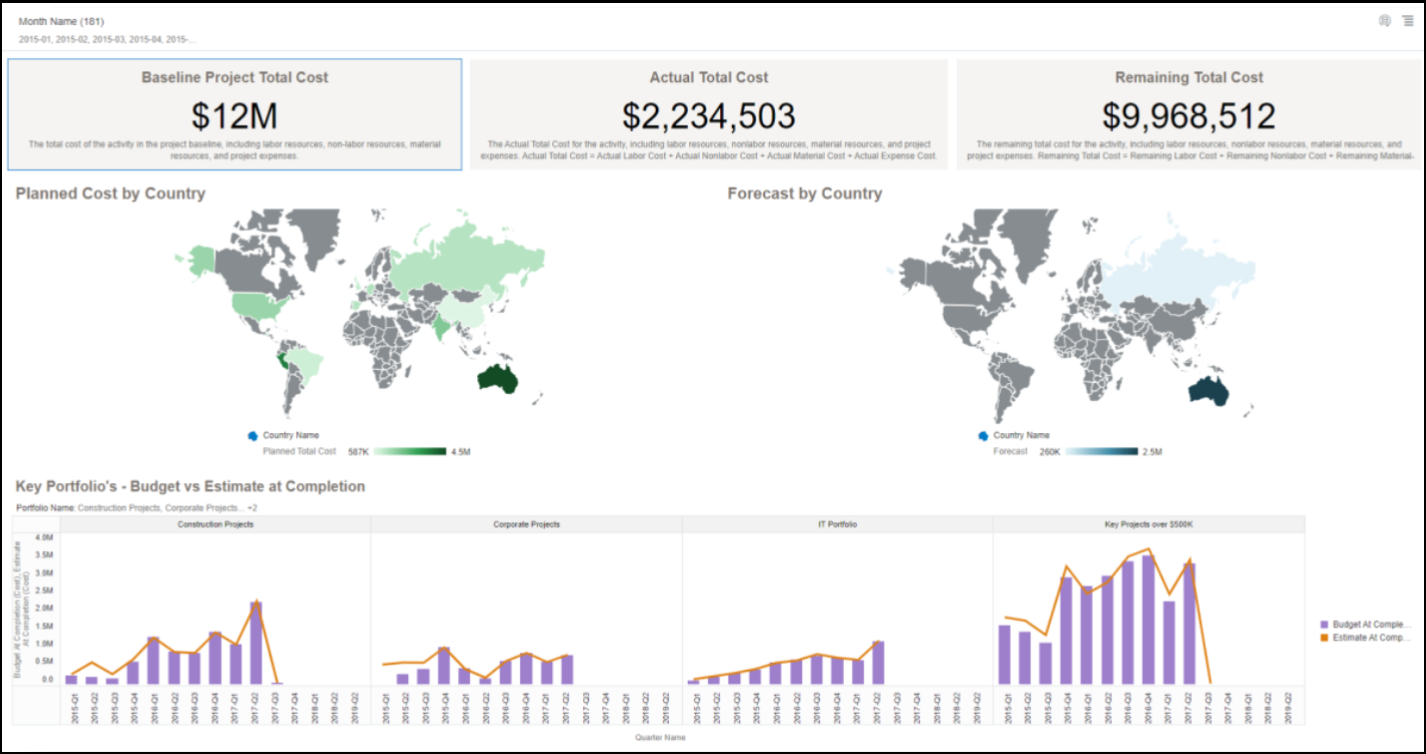
Figure 56: Cost Overview Default Canvas
Table 83: Cost KPI’s Global Outlook - Dimensions
Canvas | Dimension / Attribute | Subject Canvas Area / Dataset |
|---|---|---|
Cost KPI's Global Outlook | Country Name | P6 - Project History |
Cost KPI's Global Outlook | Quarter Name | P6 - Activity |
Cost KPI's Global Outlook | Portfolio Name | P6 - Activity |
Table 84: Cost KPI’s Global Outlook - Measures
Canvas | Fact / Measure | Measure Type | Subject Area / Dataset |
|---|---|---|---|
Cost KPI's Global Outlook | Baseline Project Total Cost | Fact | P6 - Project History |
Cost KPI's Global Outlook | Actual Total Cost | Fact | P6 - Project History |
Cost KPI's Global Outlook | Remaining Total Cost | Fact | P6 - Project History |
Cost KPI's Global Outlook | Planned Total Cost | Fact | P6 - Project History |
Cost KPI's Global Outlook | Forecast | Fact | Unifier – Cash Flow |
Cost KPI's Global Outlook | Budget At Completion Cost | Fact | P6 - Activity |
Cost KPI's Global Outlook | Estimate At Completion Cost | Fact | P6 - Activity |
Table 85: Cost KPI’s Global Outlook - Filters
Canvas | Filter Type | Is Expression Filter | Dimension / Attribute | Subject Area / Dataset |
|---|---|---|---|---|
Cost KPI's Global Outlook | Dashboard | No | Month Name | P6 – Resource Utilization |
Cost KPI's Global Outlook | Visualization | No | Portfolio Name | P6 - Activity |
Table 86: Cost KPI’s Global Outlook - Data Actions
Data Action Name | Action Type | Anchor To | Target | Canvas Link | Pass Values | Multiselection |
|---|---|---|---|---|---|---|
Test DA | Analytics Link | None | CEO DB Project | Canvas 1 | All | On |
Related Topics
Last Published Friday, December 8, 2023