Distributing Cost Data
When you create a cash flow curve, the system distributes cost data using the distribution method defined in the cash flow curve properties. Distribution can be either manual, or automatic from a defined profile.
In User Mode, the system displays commitment curve cost data in the record transaction currency, but stores costs in project currency. Currency conversion uses the active exchange rate set.
- Baseline curves use the exchange rate that was active at the time of record creation.
- Actuals curves use the exchange rate that was active at the time the money was paid.
- Forecast curves use the exchange rates in effect for each time period over the duration of the curve.
If the transaction currency is different from the project currency, you can change the currency view between transaction and project currencies. You can only edit data in the transaction currency view. If there is a more recent value in the exchange rate table, refreshing the curve will refresh the cost data. You will not see the currency menu if the business process record was created in the project currency.
Manual distribution
When you select manual distribution in the curve properties, you manually enter the data for distribution in the curve details window at run time. The system preserves cost distribution and duration when you change the From Date (start date) of baseline, custom, and forecast curves (when there are no actuals) in project/shell, summary CBS, and CBS detail curves. In other words, if you change a cash flow curve to start on a different date then it originally did, the system shifts the curve along the timeline to reflect the new date and moves the cost data to retain the integrity of the curve. The system pegs the distribution of cost data to the From Date, rather than the end or To Date. Here is how this works when the From Date changes:
- If the modified curve is the same length as the original curve, the curve shifts along the timeline to reflect the new start date and all cost data remains in the curve.
- If the modified curve is longer than the original curve, the curve will shift along the timeline to reflect the new start date, but existing data is not redistributed to the additional time periods. Each time period retains its original value and additional columns have values of zero.
- If the modified curve is shorter than the original curve, then the curve will shift along the timeline to reflect the new start date, and existing data is truncated at the new end date.
Auto by default profile distribution
A distribution profile lets you predefine the way you want the system to distribute cost data in User Mode. You can add any number of profiles in the Edit Distribution Profiles window.
The left side of the window contains:
- A list of previously created distribution profiles. Initially this list is empty.
- The Active checkbox, which controls whether the profile is available for selection for a curve.
The right side of the window contains:
- Graph: The graph is a graphical representation of the profile % that you enter over the duration %.
- Duration %: These are the x-axis units of the graph. The x-axis starts at zero (0), with another 20 slots, equally distributed up to 100%.
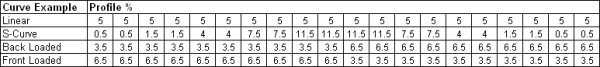
- Profile %: Starts at 0, with 20 remaining slots to enter the profile distribution percent values. You will enter incremental values in these slots. The total value of the profile % must add up to 100%. You cannot enter negative numbers in these slots. The values you enter will determine the shape of the curve, and distribution of the data.
By default, when you create a new distribution profile, the graphical display will be a linear distribution (5% is entered in each of the 20 data slots).
Following are some distribution profile examples.
Last Published Thursday, February 19, 2026