3. Dashboards
3.1 Introduction
This document is designed to help acquaint you with the features of Dashboard, on the landing screen of Oracle Financial Services Lending and Leasing. Information from multiple products is integrated and displayed as Dashboard on home screen of the application.
This manual explains the functionality of Dashboard facility and various Dashboards present in the system. Since this section details the general dashboard options available in the User Interface, some or all the parts of this section are applicable to you as per access provisions & licensing. Besides providing these details, the manual also provides a brief description of other features associated with Dashboard link. The Dashboard main Menu further provides links to the following screens:
- Dashboard
- Users Productivity
- System Monitor
- Producer Analysis
3.2 Dashboards
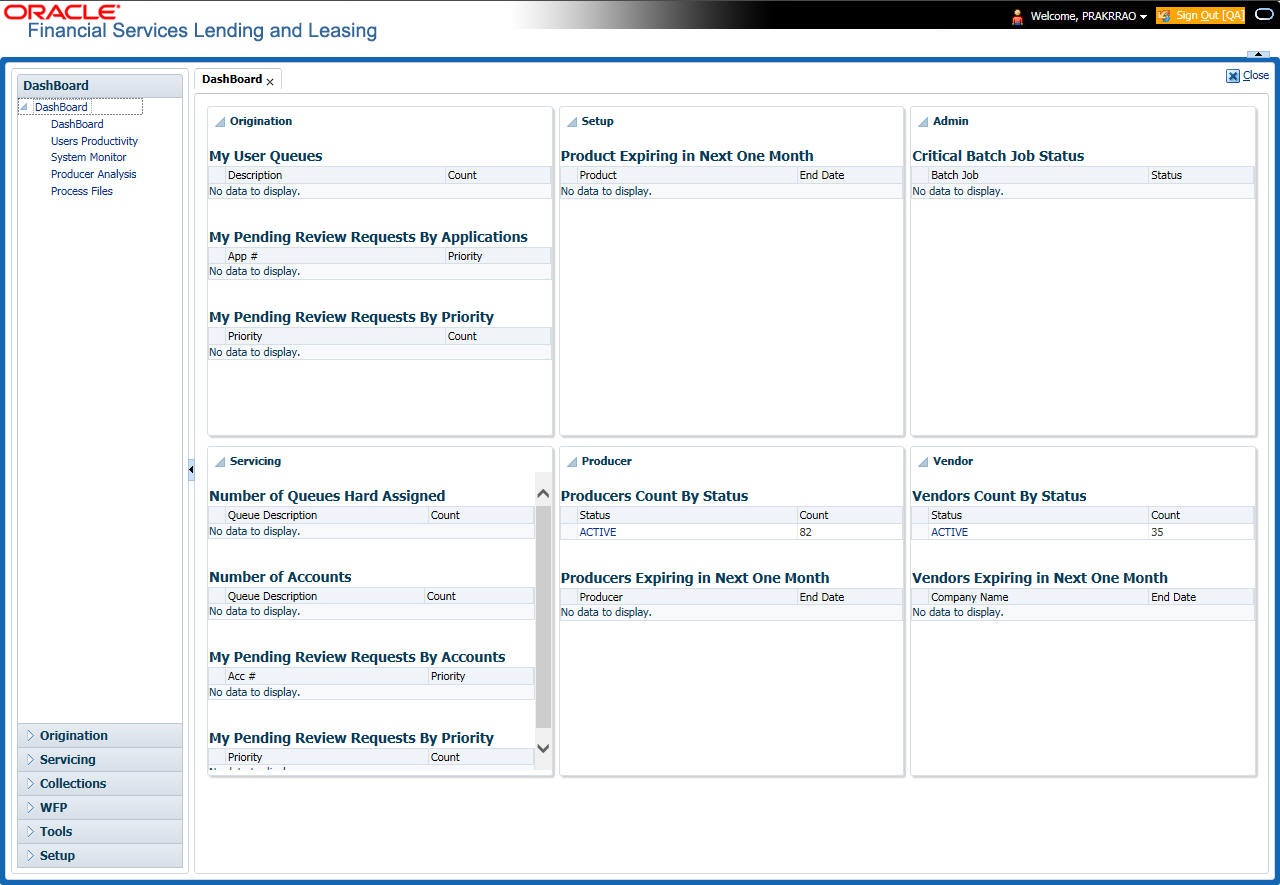
Dashboards are the tiny windows displayed on landing screen of the Application. Dashboard renders quick and crisp information of specific transactions or tasks mapped to the ‘User Role’, who logs on to the system.
The system facilitates integration of Information from different levels and displays it as Dashboard on home screen, also called the landing screen of the application.
Navigating to Dashboards
Click Dashboard > Dashboard > Dashboard.
Features
Following are the features of Dashboard:
- The system organizes Dashboards to provide comprehensive and consolidate snapshot in tiny windows, to access information easily. Thus, helping to; analyze, monitor and make better decisions which in turn help save time and cost.
- The screen is designed to display six Dashboards, distributed in two rows with three Dashboards per row, without scroll bars.
- The height and width of all Dashboards are fixed; however, you can expand or collapse the Dashboards. Click the arrow heads at the top left corner of the Dashboard windows to expand or collapse the dashboard windows.
- Each section in Dashboard is hyperlinked to home screen of the respective section. The main screen will present descriptive information of details shown in Dashboard only.
- Each window in the dashboard is provided with a
 Refresh button and clicking on the same would fetch the latest status of the dashboard being viewed.
3.3 User Productivity
Oracle Financial Services Lending and Leasing User Productivity screen is a supervisor feature that allows you to monitor the daily performances of users completing Lease origination and servicing tasks.
These tasks are categorized as customer service/collection tasks. The system updates these details on daily basis.
Using the User Productivity screen, you can review the following daily tallies:
- Number of accounts worked and call activities, by user
- Number of accounts worked and call activities, by queue
This chapter explains how to use the User Productivity screen to view this information.
Navigating to User Productivity Screen
- On the Oracle Financial Services Lending and Leasing home screen, click Dashboard > Dashboard > User Productivity.
- The system displays the User Productivity screen. You can view the tasks related to:
- Underwriting/Funding
- Customer Service/Collection
3.3.1 Viewing the Customer Service/Collection tasks
Daily tallies from the Customer Service module appear on screens opened from the following tabs on User Productivity Screen:
- Collector Activity
- Queues Status
3.3.1.1 Collector Activity
The Collector Activity screen displays the number of accounts worked and call activities by collector for the day. It also displays details regarding calls and total number of calls per queue.
To use the Collector Activity
- Click Dashboard > Dashboard > User Productivity > Collector Activity. The details on this screen are grouped into two:
- Users
- Activity Details
- In the Users section, you can view the following information.
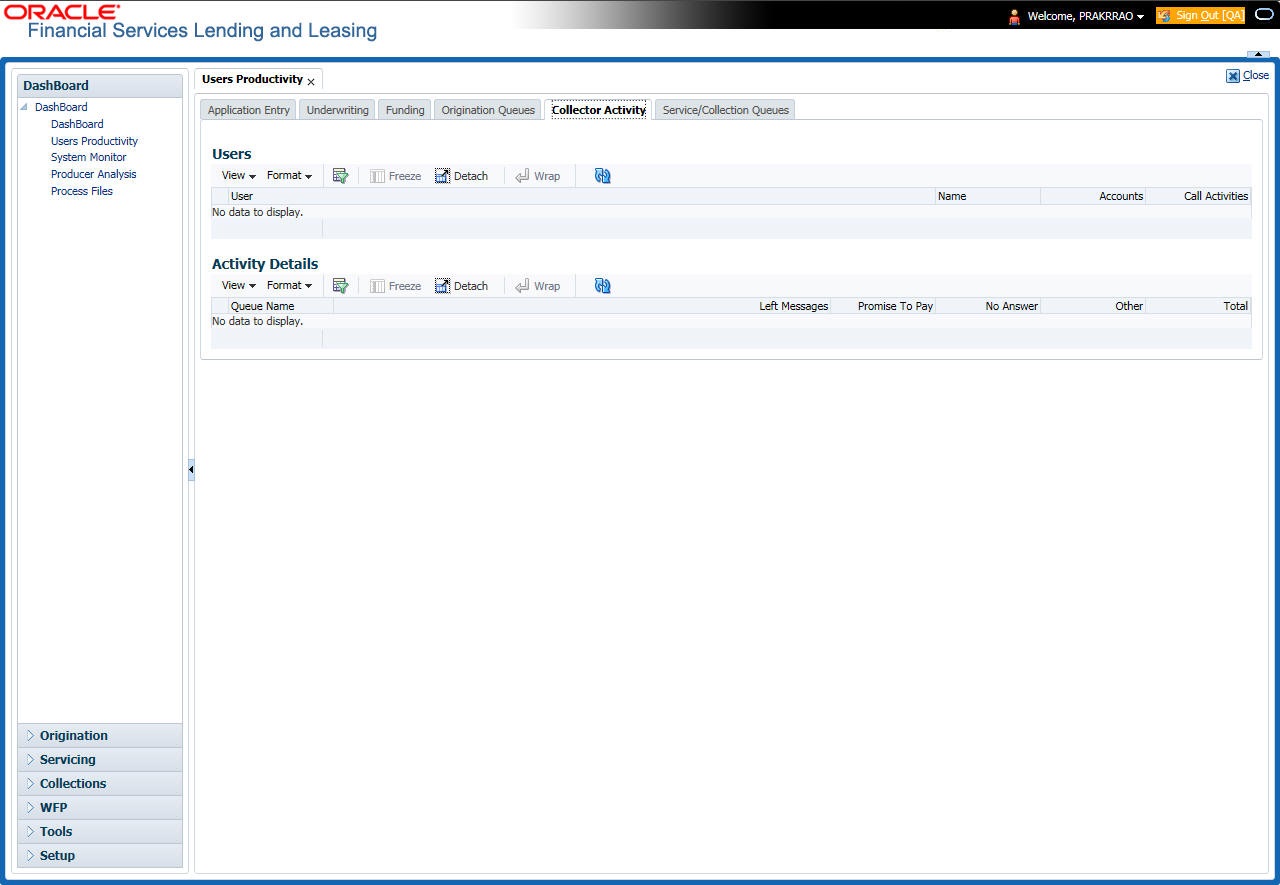
A brief description of the fields is given below:
Field: |
View this: |
User |
Displays the user code. |
Name |
Displays the user name. |
Accounts |
Displays the number of accounts worked. |
Call Activities |
Displays the number of call activities. |
- In the Activity Details section, you can view information for the selected user. A brief description of the fields is given below:
Field:
View this:
Queue Name
Displays the queue name.
Left Messages
Displays the left message activity count.
Promise To Pay
Displays the promise to pay activity count.
No Answer
Displays the no answer activity count.
Other
Displays the other activity count.
Total
Displays the total activity count.
3.3.1.2 Service/Collection Queues
The Service/Collection Queues Status tab displays daily information regarding queues, such as the number of accounts worked, number of call activities, number of accounts pending, and totals number of accounts in the queue. It also displays information about the users who worked on these queues and details of the call activities.
To use the Queues Status tab
- Click Dashboard > Dashboard > User Productivity > Service/Collection Queues tab. The details are grouped into two:
- Service/Collection Queues
- Activity details
- In the Service/Collection Queues section, you can view the following information.
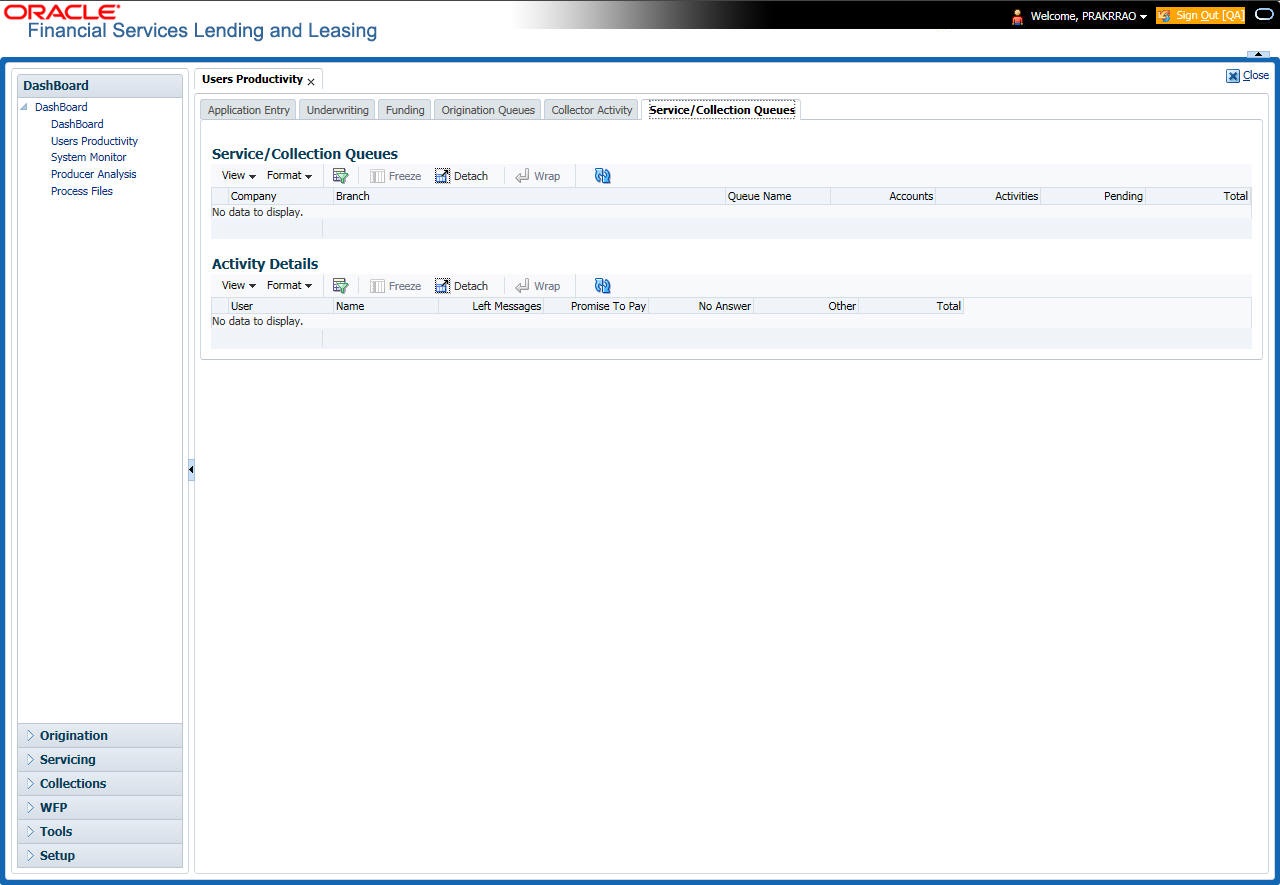
A brief description of the fields is given below:
Field: |
View this: |
Company |
Displays the company name. |
Branch |
Displays the branch. |
Queue Name |
Displays the queue name. |
Accounts |
Displays the number of accounts worked. |
Activities |
Displays the number of call activities. |
Pending |
Displays the number of accounts pending. |
Total |
Displays the number of total accounts. |
In the Activity Details block, you can view information for the selected queue. A brief description of the fields is given below:
Field: |
View this: |
User |
Displays the user code. |
Name |
Displays the user name. |
Left Messages |
Displays the left message activity count. |
Promise To Pay |
Displays the promise to pay activity count. |
No Answer |
Displays the no answer activity count. |
Other |
Displays the other activity count. |
Total |
Displays the total activity count. |
3.4 System Monitor
The System Monitor screen is the one stop place to check all the activities in and around the system. It maintains the progress of;
- Batch Jobs
- Jobs
- Services
- Database Server Log Files
- Users
Navigating to System Monitor
On the Oracle Financial Services Lending and Leasing home screen, click Dashboard > Dashboard > System Monitor.
3.4.1 Monitoring Batch Jobs
The system tracks the success of each batch process on the Batch Job. If either a set of batch jobs or specific batch job should fail, you can resubmit it on this screen and review the results in Request Details section.
The Monitor Batch Jobs screen is only a display screen that contains the following sections:
- Batch Job Sets
- Batch Jobs
- Batch Jobs Threads
- Request Details
- Request Results
To Monitor Batch Job
- Click Dashboard > Dashboard > System Monitor > Batch Jobs.
- In the Batch Job Sets section, you can view the following information
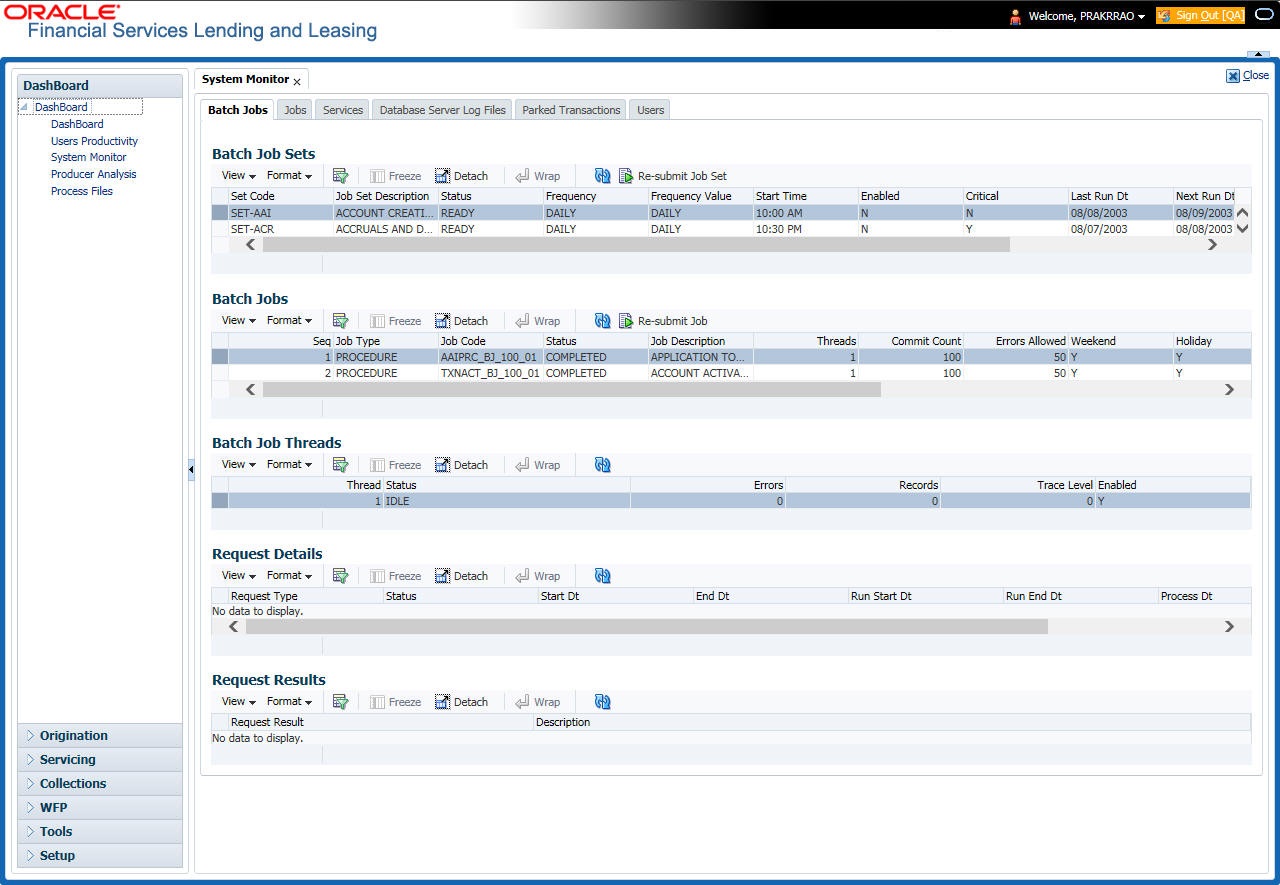
A brief description of the fields is given below:
Field: |
View this: |
Set Code |
Displays the code for batch job set. |
Job Set Description |
Displays the description for batch job set. |
Status |
Displays the job set status. |
Frequency Code |
Displays the frequency at which the job set is to be executed. |
Frequency Value |
Displays the value of frequency code chosen for the job set. |
Start Time |
Displays the start time for the job set. |
Enabled |
Displays if the job set is enabled or not. |
Critical |
Displays if this job set is critical or not. |
Last Run Dt |
Displays the date of last run of the job set. |
Next Run Dt |
Displays the next run date for job set. |
Parent |
Displays the preceding job set. |
Dependency |
Displays the type of dependency on predecessor. |
To resubmit a batch job set
Whenever a batch job set fails, it is best to resubmit it after correcting the errors that caused the failure. Resubmitting a set causes system to re-perform the batch job set and dependent batch jobs.
- In the Batch Job Sets section, choose the batch job set to resubmit (only a batch job set with a status of FAILED can be resubmitted), then click Resubmit Job Set button.
The Batch Job screen also allows you to resubmit jobs which are in READY or COMPLETED or FAILED status if you have access key privileges define for your user responsibility. If provisioned, then a ‘Force Re-Submit Job Set’ button is available instead of ‘Resubmit Job Set’ button to resubmit the jobs with above status.
The Batch Jobs section lists the batch jobs within a job set. The status, threads, commit count, dependencies, enabled indicator and the holiday and weekend runtime indicators are shown for each job.
A brief description of the fields is given below:
Field: |
View this: |
Seq |
Displays the batch job sequence number. |
Job Type |
Displays the batch job request type. |
Job Code |
Displays the batch job request code. |
Status |
Displays the job status. |
Job Description |
Displays the batch job description. |
Threads |
Displays the number of threads used by the job. |
Commit Count |
Displays the number of rows after which auto-commit is triggered. |
Errors Allowed |
Displays the number of errors allowed. |
Weekend |
Displays if the batch job will execute job on weekend or not. |
Holiday |
Displays if the batch job will execute job on a holiday or not. |
Enabled |
Displays if the job is enabled or not. |
Parent |
Displays the preceding job. |
Dependency |
Displays the type of dependency on predecessor. |
Command |
Displays the command line for the job. |
Rollback Segment |
Displays the rollback segment for job. |
To resubmit a batch job
Whenever a batch job fails, it is best to resubmit it after correcting the errors that caused failure. Resubmitting a set will cause system to re-perform the batch job.
- In the Batch Jobs section, choose the batch job to resubmit (only a batch job with a status of FAILED can be resubmitted), then choose Resubmit Job Set.
- The Batch Job Threads section displays the status of individual threads.
A brief description of the fields is given below:
Field: |
View this: |
Thread |
Displays the name of thread. |
Status |
Displays the status of thread. |
Errors |
Displays the number of errors in the thread. |
Records |
Displays the number of records in the thread. |
Trace Level |
Displays the SQL trace level (0, 1, 4, 8, 12). |
Enabled |
Displays if the job thread is enabled or not. |
The Request Details section displays the status and runtimes for each time the selected job ran.
A brief description of the fields is given below:
Field: |
View this: |
Request Type |
Displays the job request type. |
Status |
Displays the job request status. |
Start Dt |
Displays the job request is valid from this date and time. |
End Dt |
Displays the job request is valid till this date. |
Run Start Dt |
Displays the date and time on when the job run started. |
Run End Dt |
Displays the date and time at which the job run ended. |
Process Dt |
Displays the transaction is posted with this General Ledger effective date. |
Description |
Displays the job request description. |
If a particular job requires that a result message be created, then that message appears in the Request Results section. A message is usually created in the event of an error.
A brief description of the fields is given below:
Field: |
View this: |
Request Results |
Displays the result of job request. |
Description |
Displays the result details. |
3.4.2 Monitoring Jobs
The Monitor Jobs screen provides another view of monitoring all system processes, including credit bureau requests and payment posting. This screen displays the data in reverse chronological order of the Run Start Date/Time, whereas the Monitor Batch Jobs screen provides the historical data about each job and job set.
To Monitor Job Details
- Click Dashboard > Dashboard > System Monitor > Jobs.
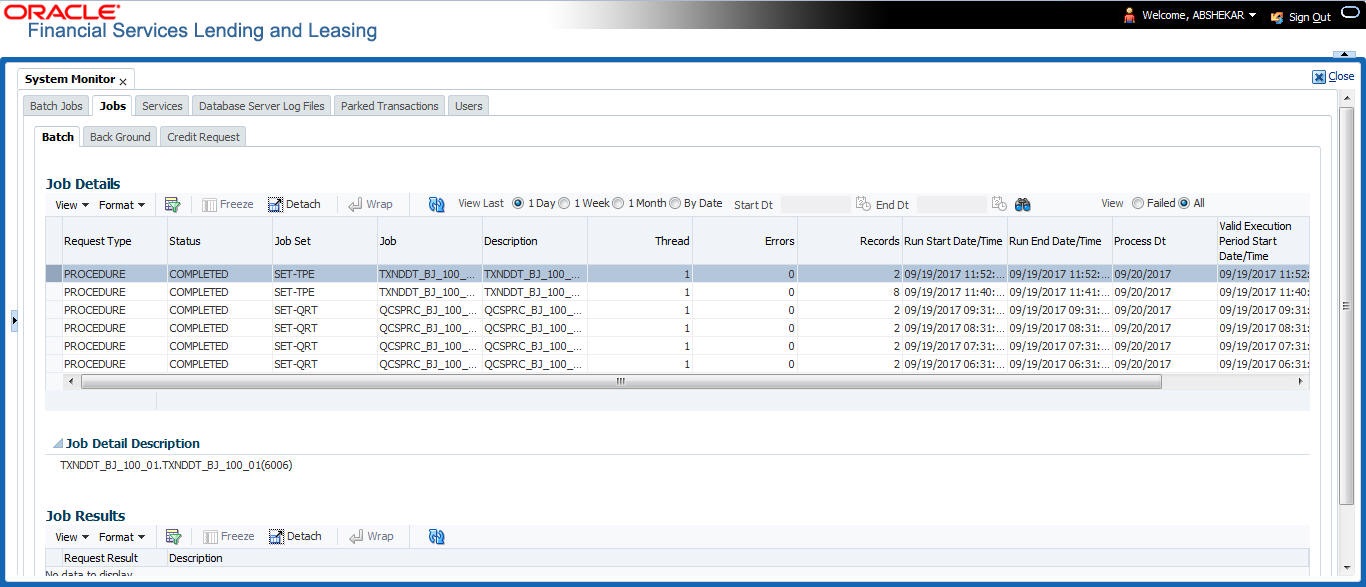
- On the Job screen, you can select any of the following type of jobs which are available in separate tabs:
Select:
System Displays:
Batch
Batch jobs (used primarily for the nightly processes).
Back Ground
User submitted requests, such as reports and payment posting.
Credit Request
Credit bureau requests.
- In the Job Details section, select the time frame based on elapsed days. You can select any of the following options:
Select:
System Displays:
1 Day
All the types of jobs selected in Jobs Type section in last one-day.
1 Week
All the types of jobs selected in Jobs Type section in last one-week.
1 Month
All the types of jobs selected in Jobs Type section in last one-month.
By Date
All the types of jobs selected in Jobs Type section for specific duration. You can specify a date range (within 3 months) in ‘Start Dt’ and ‘End Dt’ fields using the adjoining calendar and click ‘Search’.
- If you select Failed option in the View section, the system displays failed jobs on the type and time frame you have selected.
- In the Job Details section, you can view the following information about jobs matching the contents of Job Type, View Last and Failed boxes:
A brief description of the fields is given below:
Field: |
View this: |
Request Type |
Displays the job request type. |
Status |
Displays the job request status. |
Job Set |
Displays the job set code. |
Job |
Displays the job description. |
Thread |
Displays the job thread. |
Errors |
Displays the number of errors. |
Records |
Displays the number of records processed by the job. |
Run Start Date/Time |
Displays the job run start date time. |
Run End Date/Time |
Displays the job run end date time. |
Description |
Displays the job request description. |
Process Dt |
Displays the job process date. |
Valid Execution Period |
|
Start Date/Time |
Displays the job start date/time. |
End Date/Time |
Displays the job end date time. |
- In the Job Results section, you can view the following information about the Job selected in Job Details section:
A brief description of the fields is given below:
Field: |
View this: |
Request Type |
Displays the job request type. |
Description |
Displays the job request description. |
3.4.3 Monitoring Services
The Services screen allows you to track and maintain the system’s processing services, including credit bureaus, fax-in and batch job scheduler. The system administrator can start or stop the service on this screen using the action buttons respectively.
To stop, start or refresh a processing service
- Click Dashboard > Dashboard >System Monitor > Services.
- In the Services section, you can view the following information about the system’s processing services:
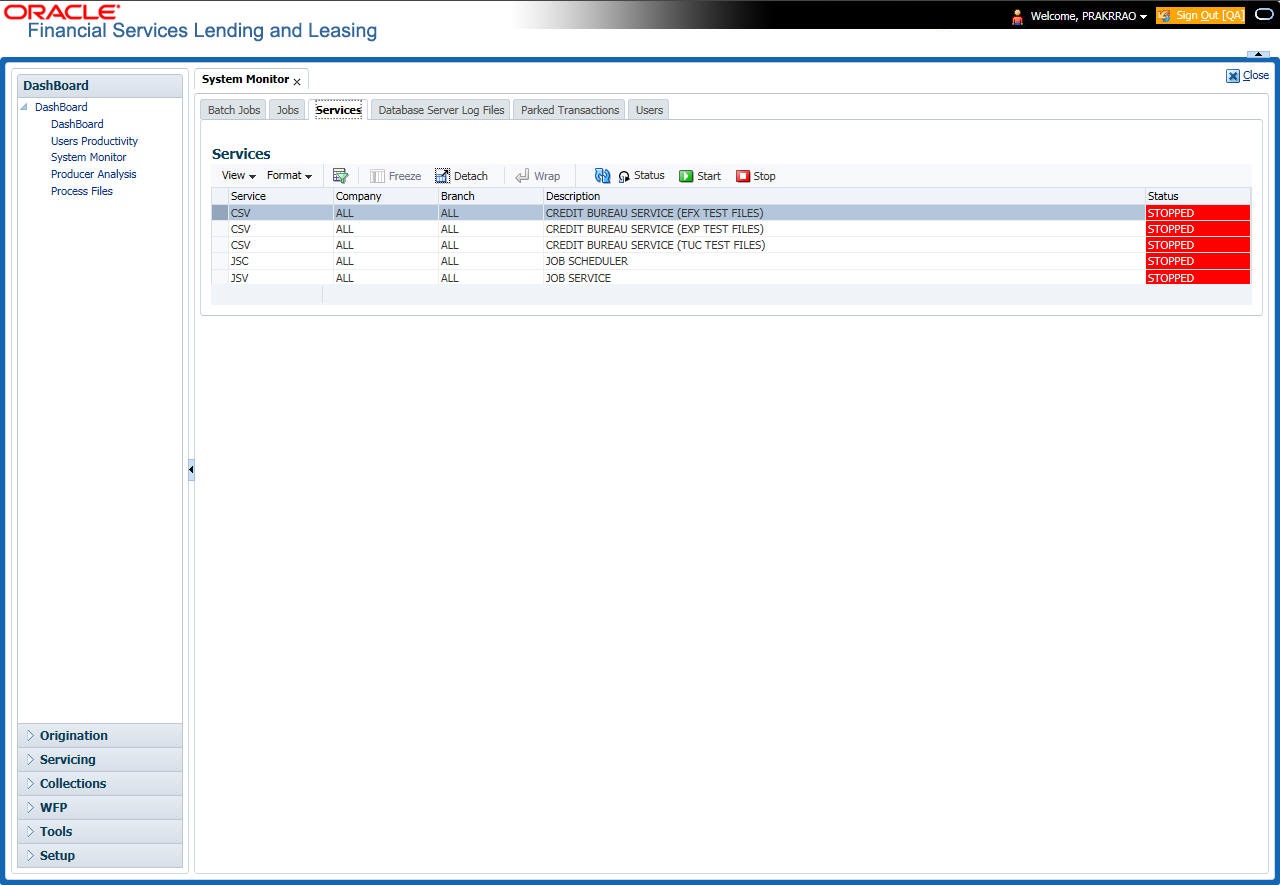
A brief description of the fields is given below:
Field: |
View this: |
Service |
Display the service name. |
Company |
Display the service company. |
Branch |
Display the service branch. |
Description |
Display the service description. |
Status |
Display the service status. |
- In the Action section, select the processing service you want to work with and choose one of the following commands in Action section.
Choose:
System:
Status
Refreshes (updates) the status of service. The Service screen does not update the status in real time. You must choose Status after choosing Start or Stop to perform that command.
Start
Starts the job service.
Stop
Stops the job service.
3.4.4 Database Server Log Files
Various processes in the system create reports in different log files with regards to what tasks they performed and what they encountered (for example, errors, failures, erroneous data and so on). The Database Server Log files tab lists and describes all such log files within the system on the database server.
To view a log file on the database server
- Click Dashboard > Dashboard > System Monitor > Database Server Log Files.
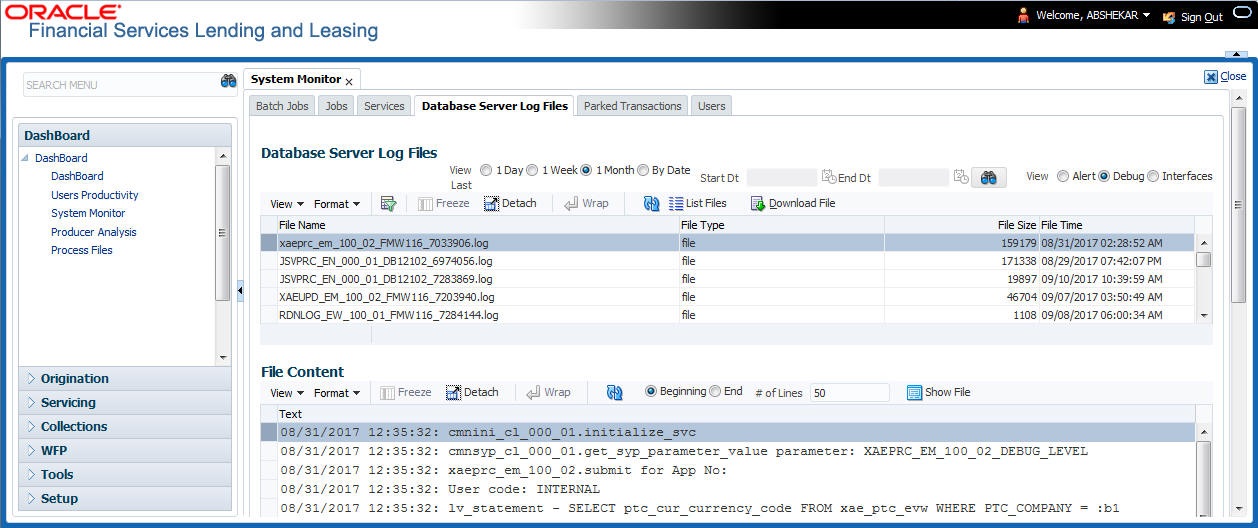
- In the Database Server Log Files section, you can sort the list of logs to be displayed based on following options:
- Select the ‘View Last’ option to display the logs based on elapsed days by selecting 1 Day / 1 Week / 1 Month / By Date. If ‘By Date’ option is selected, you can specify a date range (within 3 months) in Start Dt and End Dt fields using the adjoining calendar. Click ‘Search’.
- Select the ‘View’ option to further filter the list based on the type of logs to be displayed by selecting Alert / Debug / Interfaces.
- Click on
 List Files button to view the list of logged files. A brief description of the fields are given below
Field
View this:
File Name
Displays the name of file.
File Type
Displays the type of file.
File Size
Displays the size of file.
File Time
Displays the date and time stamp of file.
- To extract a local copy of debug details, click
 Download File button and save the file.
- In the File Content section you can view the content of the file selected in the Database Server Log Files by clicking
 Show File button.
- To sort the view of file contents, select the order as either ‘Beginning’ or ‘End’ and specify the value for ‘# of Lines’ to be displayed (default 50).
3.4.5 Monitoring Users
The Users Logins section allows you to view all users who have logged on to the system, along with the log on time stamp and logout time stamp. The information appears in reverse chronological order of the log on time stamp.
To monitor users who have logged on to the system
- Click Dashboard > Dashboard >System Monitor > Users.
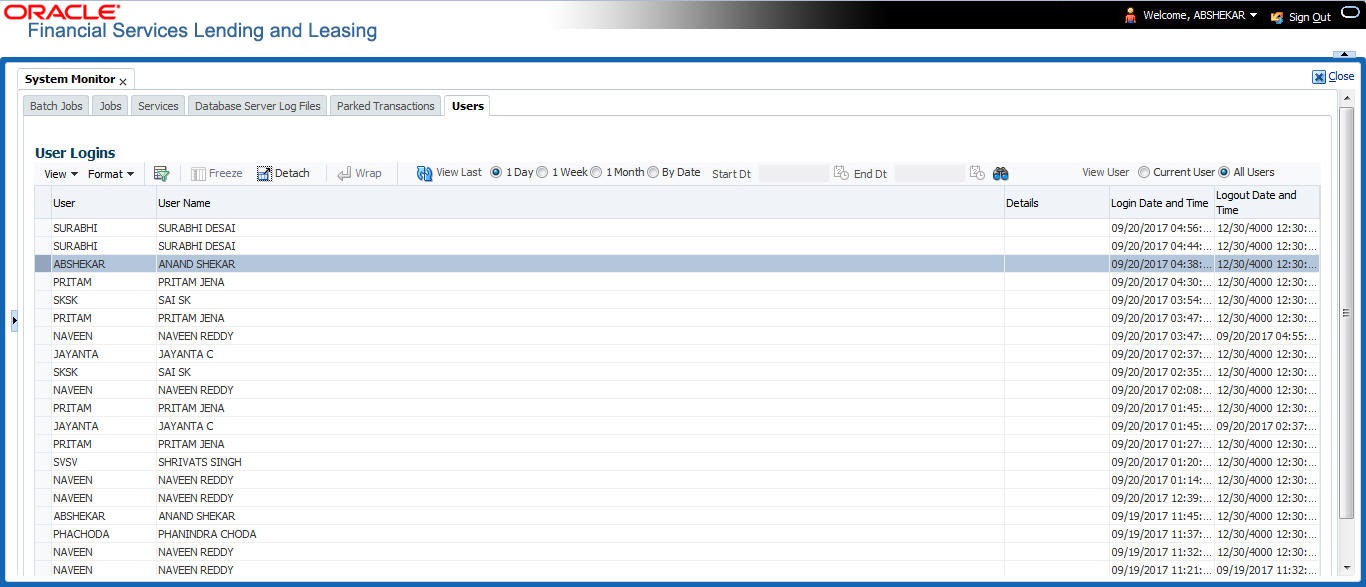
- In the User Logins section, sort the list of records to be displayed based on elapsed days by selecting 1 Day / 1 Week / 1 Month / By Date. If ‘By Date’ option is selected, you can specify a date range (within 3 months) in ‘Start Dt’ and ‘End Dt’ fields using the adjoining calendar. Click ‘Search’.
A brief description of the fields is given below:
Field: |
View this: |
User |
Displays the user ID. |
User Name |
Displays the user name. |
Details |
Displays the details. |
Login Date and Time |
Displays the login date time for the user. |
Logout Date and Time |
Displays the logout date time for the user. |
3.4.6 Monitoring JMS Queues
OFSLL uses MDB infrastructure as an interface for asynchronous communication with third-party integrated applications and all the outgoing communications through all the interfaces are tracked in ‘JMS Queues’ tab.
The ‘JMS Queues’ tab in System Monitor screen facilitates as a dashboard to monitor the status of all the configured MDB (Message-Driven Bean) queues and provides a statistics of the total messages / requests that are sent from OFSLL to external system along with their status.
The ‘JMS Queues’ tab has the following sub tabs:
- Status sub tab - to view the last status of configured MDB
- Messages sub tab
- To view the list of configured interfaces and total messages triggered to the interface.
- To view the status of response for the message received from the interface.
- To ‘Re-submit’ failed messages.
To view the status of all the configured MDB
- Click Dashboard > Dashboard > System Monitor > JMS Queues. The Status sub tab is displayed by default.
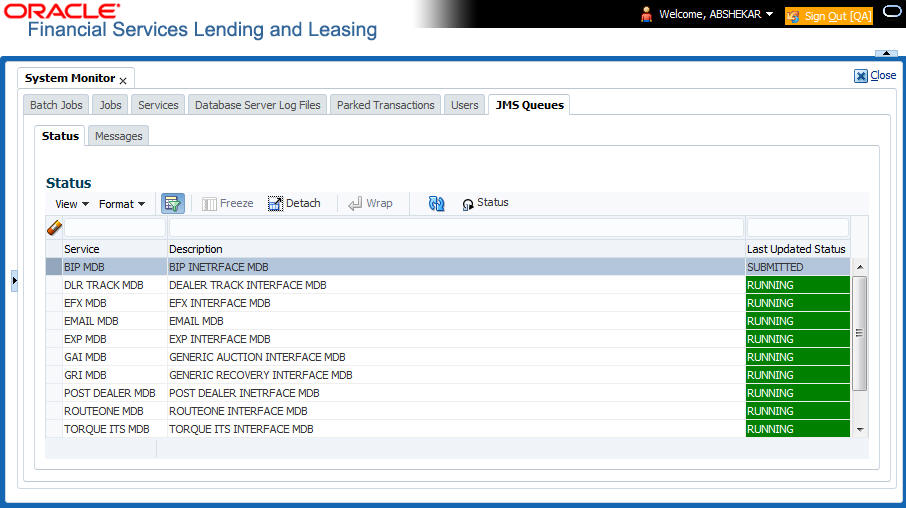
- In the ‘Status’ section, you can view the following details of configured MDB:
Field
View this:
Service
Displays the name of the message service suffixed by MDB to differentiate the different MDB services.
Description
Displays the description or abbreviated name of MDB interface.
Last Updated Status
Displays the status of MDB interface. Following are the status displayed:
• UNKNOWN - indicates that no MDB infrastructure is connected or status ping message is not sent to that MDB.
• SUBMITTED - indicates that a dummy ping message is sent to MDB.
• RUNNING - indicates that the message is consumed by MDB infrastructure.
• STOPPED - indicates if MDB infrastructure is down.
- In the ‘Status’ section, select the required service for which you need the status and click Click
 button. On clicking, a dummy ping is sent to the interfaced server and status in ‘Last Updated Status’ column is updated as ‘SUBMITTED’.
- Click
 (refresh) button, to fetch the latest status and the response received is updated in ‘Last Updated Status’ column.
To view the messages triggered to all configured MDB
- Click Dashboard > Dashboard > System Monitor > JMS Queues > Messages tab.
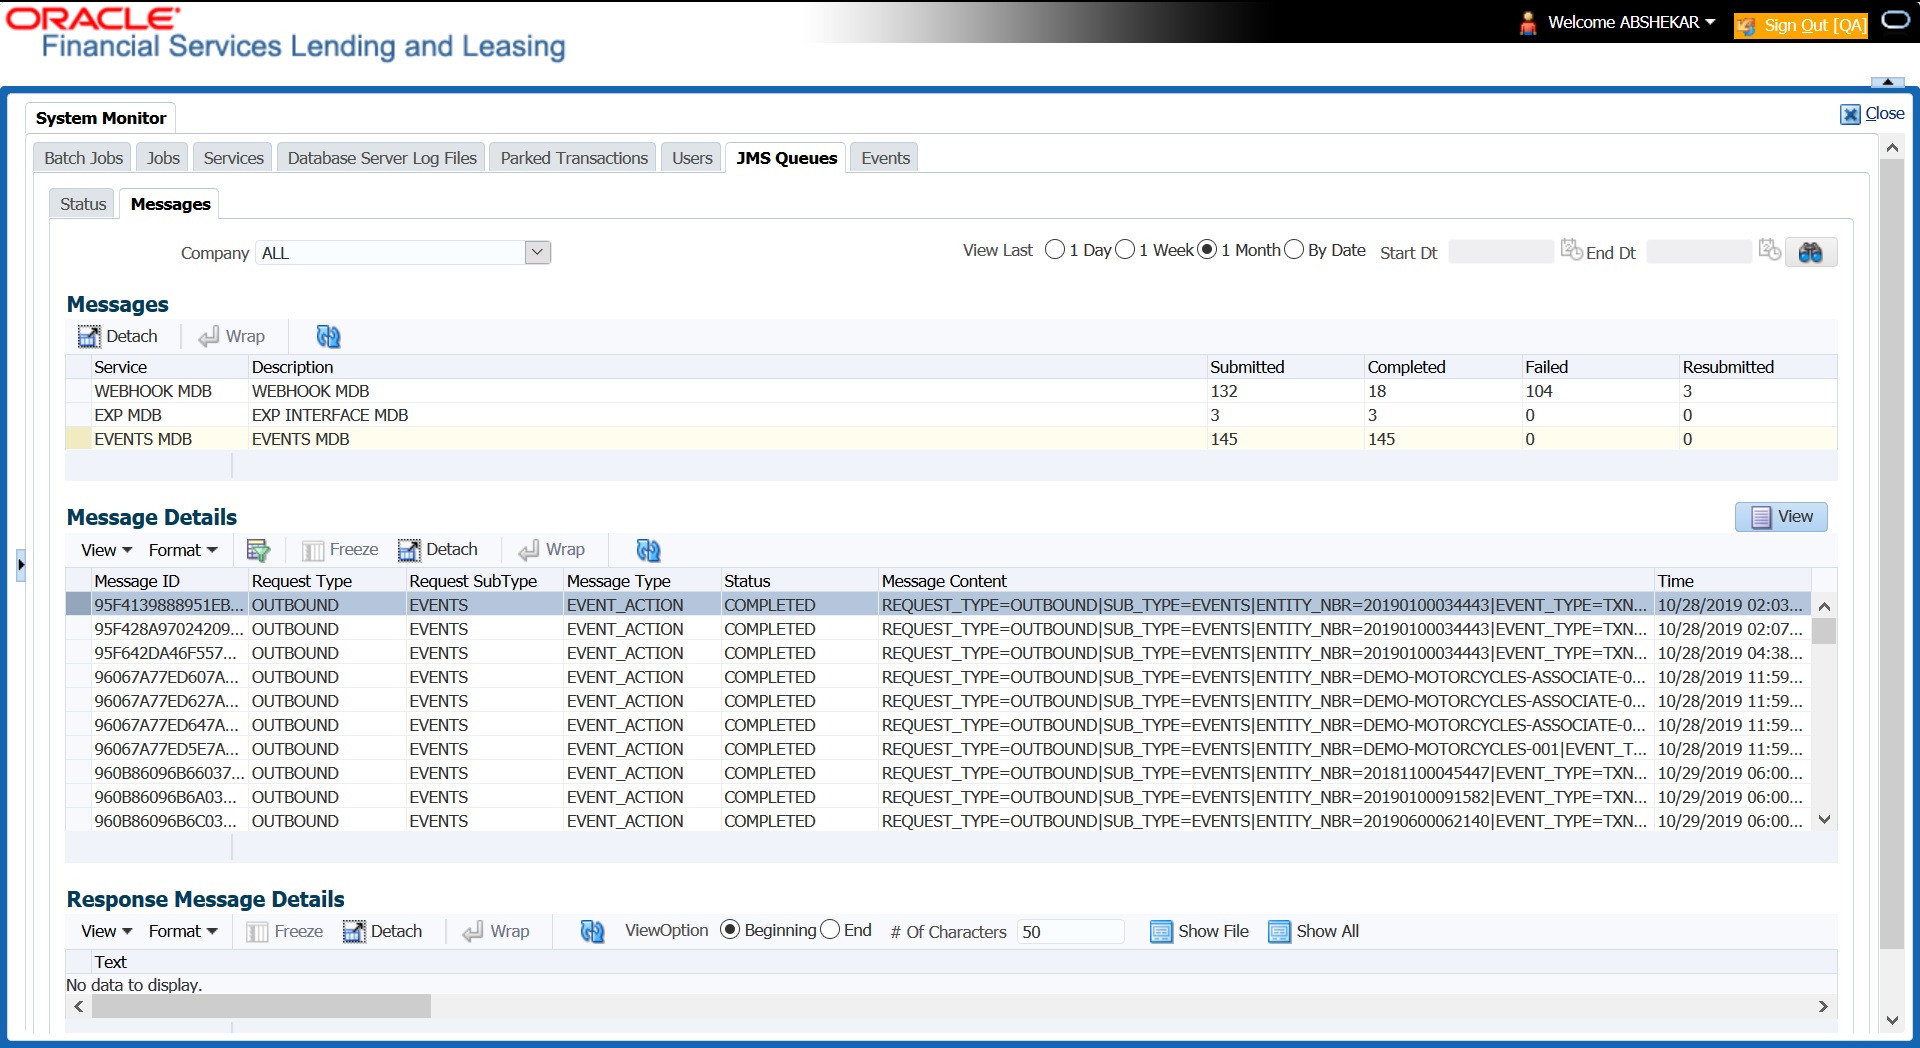
- In the ‘Messages’ section, filter the list of messages using the following options:
- Select the required Company from the drop-down list to view JMS message at company level. The list is populated only with those Company Definitions to which you have been provisioned access. By default, ‘ALL’ is selected.
- Select the ‘View Last’ option to display the messages based on elapsed days by selecting 1 Day (default) / 1 Week / 1 Month / By Date. If ‘By Date’ option is selected, you can specify a date range (within 3 months) in ‘Start Dt’ and ‘End Dt’ fields using the adjoining calendar.
- The ‘Messages’ section displays the list of configured interfaces and the total of messages exchanged between OFSLL and MDB in Submitted, Completed, Failed and Resubmitted status. Click
 (refresh) button to update the latest status.
- In the ‘Messages’ section, you can view the following details:
Field
View this:
Service
Displays the name of the message service suffixed by MDB to differentiate the different MDB services.
Description
Displays the description or abbreviated name of MDB interface.
Submitted
Displays the total count of requests submitted.
Completed
Displays the total count of requests completed.
Failed
Displays the total count of requests failed.
Resubmitted
Displays the total count of only those requests which are failed and resubmitted again for processing.
To ‘Re-submit’ failed messages
- Click Dashboard > Dashboard > System Monitor > JMS Queues > Messages tab.
- In the ‘Messages’ section, select the required MDB interface.
- The ‘Message Details’ section below displays the list of messages sent to the interface with the following details:
Field
View this:
Message ID
View the system generated MDB message ID
Request Type
View the message request type
Request SubType
View the message request sub type
Message Type
View the message identifier
Status
View the message processing status
Response
This column data is displayed only for Webhook MDB.
View the HTTP Header received as response during Webhook event action invocation.
Message Content
View the message content
Time
View the message time stamp
- In the ‘Message Details’ section, select the message in ‘Failed’ status. Click
 (refresh) button to update the latest status.
- (Optional) You can click ‘View’ to display the selected record in ‘Message Details’ section.
- Click
 Re-submit. The details are triggered again for processing and the ‘Resubmitted’ counter in ‘Messages’ section is updated along with other counters.
Response Message Details
This section is enabled if Events or Webhook type of MDB service is selected in Message section and displays the request Message Details that is propagated to external system for the posted event action.
To view ‘Response Message Details’ of an Event
- Select the required record from the Message Details section and click ‘Show File’.
- The first 50 characters of the request in json format is displayed since the default preference selected is ‘Beginning’ in View option and ‘# of Characters’ is set to 50.
- You can customize the preference using View Option (Beginning / End) and specifying the number of characters to be displayed.
- Also you can click ‘Show All’ to display the complete request.
3.4.7 Monitoring Events
The Events screen is a dashboard to view all the Events triggered in the system. In the Events screen you can view the latest status of all the processed events and ‘Re-submit’ only failed events for re-processing. However, this is a display-only field and does not allow to modify the defined event action parameters.
The Events screen has the following sections:
- Event Actions
- Action Parameters
In the ‘View Options’ section, you can filter and view the list of Events based on following Status:
- ALL
- SUBMITTED
- WAITING FOR USER INPUT
- COMPLETED
- FAILED
- CRITERIA NOT MET
- VOID
In the ‘View Last’ section, you can further sort the volume of records displayed on the Events screen with the following options:
Select: |
System Displays: |
1 Day |
List of all events posted in last one-day. |
1 Week |
List of all events posted in last one-week. |
1 Month |
List of all events posted in last one-month. |
By Date |
List of all events posted between specific dates. You can specify a date range (within 3 months) in ‘Start Dt’ and ‘End Dt’ fields using the adjoining calendar. |
To View the Events triggered in the system
- On the Oracle Financial Services Lending and Leasing home screen, Click Dashboard > System Monitor > Events tab.
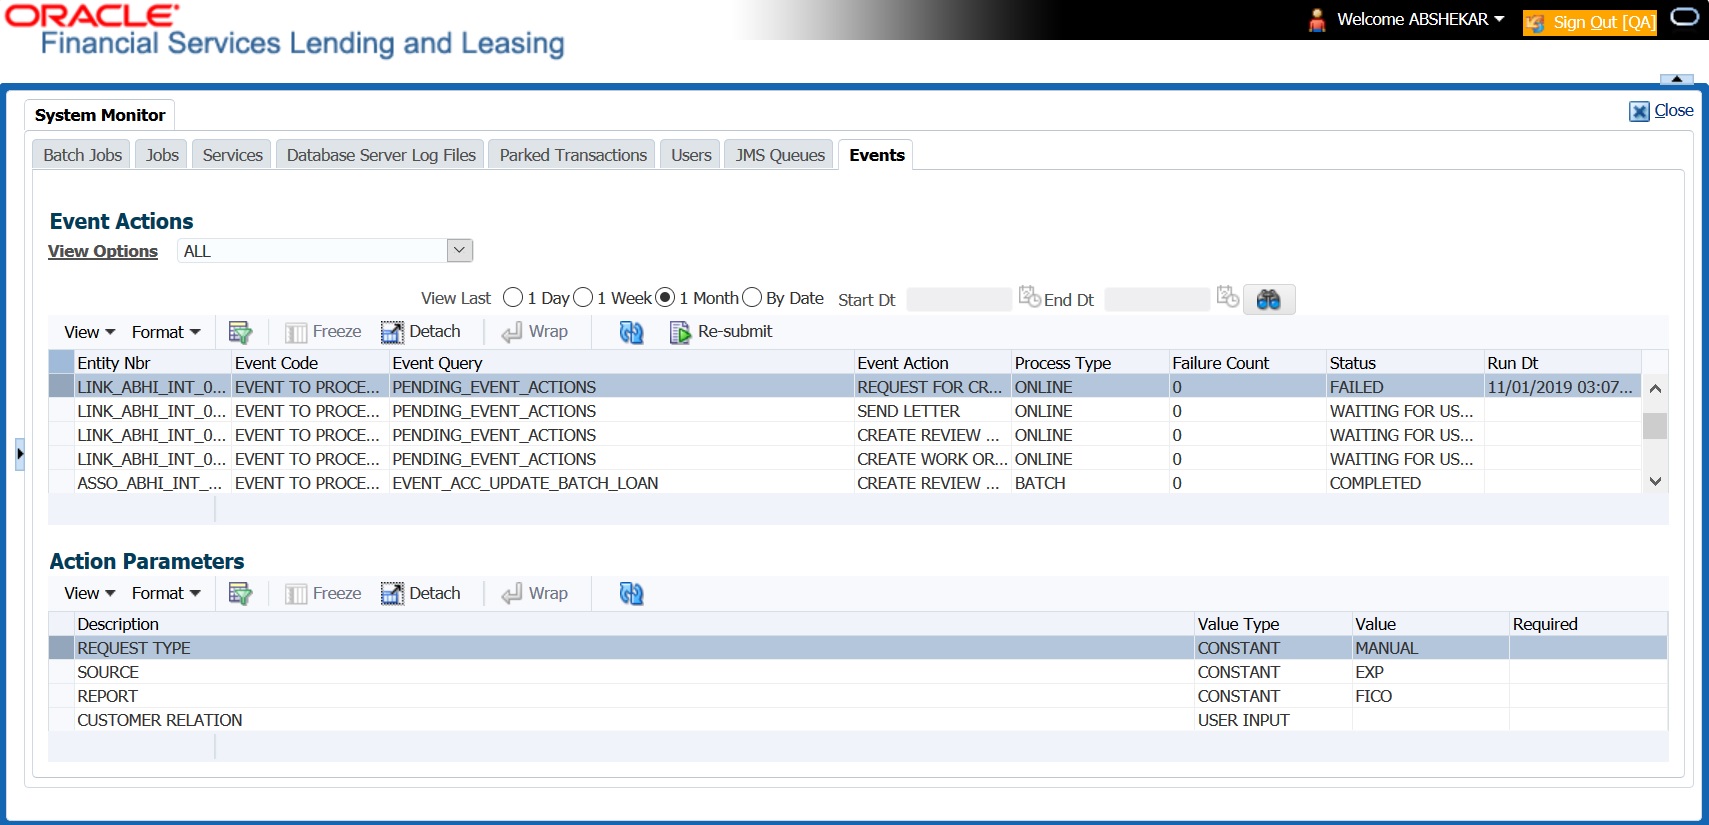
- By default, the Events screen displays all events posted in last one day.
- In the ‘Event Actions’ section, view the following information:
Field:
View this:
Entity Nbr
Entity Number on which event generated.
Event Code
Event Definition Description.
Event Query
Event Criteria Definition Description.
Event Action
Event Action Description.
Process Type
Event processing type as either Online/Batch fetched from EVENT_PROCESS_TYPE_CD lookup.
Failure Count
Number of times the event processing has failed.
Status
Event action with following execution status:
CRITERIA NOT MET
SUBMITTED
VOID
COMPLETED
FAILED
ALL
WAITING FOR USER INPUT
Run Dt
Event Action Generation Date and Time.
- In the ‘Action Parameters’ section, view the following information:
Field:
View this:
Description
Event Action Parameter Description.
Value Type
Event Action Input Parameter Type.
Value
Value defined for the event action.
Required
Y/N indicating if the Action Parameter is mandatory.
Re-submit Failed Events
In the Events screen you can filter and re-submit only the ‘FAILED status Online Event Actions’ for processing. An Event is marked with ‘Failed’ status when the same could not be processed in the system due to setup/infrastructure issues. This is an additional option to re-process the event actions. On resubmitting an event, the Failure Count against the record is incremented by 1.
However, ‘Resubmit’ option is not allowed for Webhook and SEND JMS MESSAGE actions since the same functionality is available in JMS Queues.
In the ‘Event Actions’ section, select the required event record listed with status FAILED and click ‘RE-submit’. On triggering the event, the ‘Run Dt’ column is updated with Event Action Generation Date and Time. Click ‘Refresh’ to fetch the latest status.
3.5 Producer Analysis
The Producer analysis screen enables you to view and know the status of all applications sourced by different Producers.
Navigating to Producer Analysis
Click Dashboard > Dashboard > Producer Analysis.
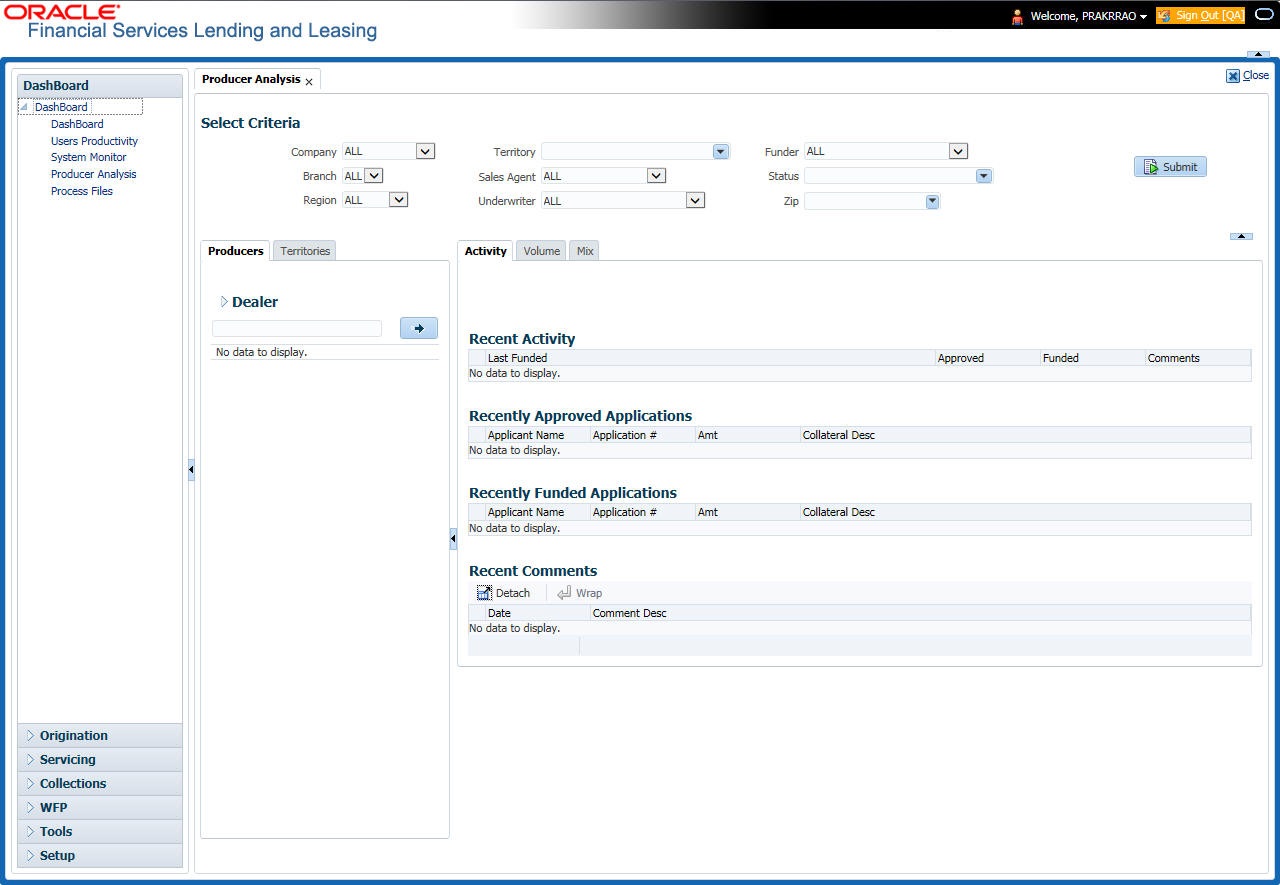
You can filter producer details based on any or all of the following criteria:
- Company
- Branch
- Region
- Territory
- Sales Agent
- Underwriter
- Funder
You can select the values from the adjoining drop-down list. Click ‘Submit’ button. System displays the Producer details satisfying the criteria, you selected.
The following details are displayed under Producer Details section:
- Producer #
- Name
- Company
- Branch
- Type
Select the producer you need to view the statistics. The system displays the statistics under ‘Summary’ sub tab and the status and sub status of various applications under ‘Applications’ sub tab, of the selected producer.
The system displays the following details under ‘Summary’ sub tab:
- Year
- Total Apps
- Approved
- Conditioned
- Rejected
- Withdrawn
- Funded
- Amount
The system displays the following details under ‘Applications’ sub tab:
- Company
- Branch
- App #
- Date
- Title
- Product
- Status
- Sub Status
3.6 Process Files
The Process files screen allows you to view the incoming and outgoing files exchanged between OFSLL and other interfaced systems for processing and also perform a bulk upload of required files.
The Process files interface also provide information on the type of files uploaded along with other attributes. In-order to facilitate the process files handling, the following parameters has to be enabled in Setup > Administration > System > System Parameters screen. For more information on enabling system parameters, refer to ‘System Parameters’ section in Setup Guides.
- CMN_FILE_PROCESS_TO_LOB
On enabling the above parameter, system stores the incoming / outgoing documents in the relevant tables and not in the file system.
- UIX_INCOMING_FILE_PATH
- UIX_OUTGOING_FILE_PATH
On enabling the above two parameters, the incoming and outgoing file path of application server need to be defined to the required folder path by updating the ‘Parameter Value’ which by default is ‘SETME’. (For example: /tmp)
- If both the parameter ‘CMN_FILE_PROCESS_TO_LOB’ and ‘OUTBOUND_CALL_Q’ are enabled (status ='Y'), system automatically handles upload/download of files from Weblogic configured process files.
Depending on the CLOB parameter option, if set to ‘Y’ the incoming/outgoing file directories are to be manually created in Web Logic server. For details of directories, refer to ‘Creating Application Home directory’ section in Database Installation Guide.
3.6.1 Incoming Process File
The incoming process file screen displays the list of files being shared from an external system along with other attributes such as directory path, file name, type, size, date and status. You can select the file required and upload it into the system for immediate processing.
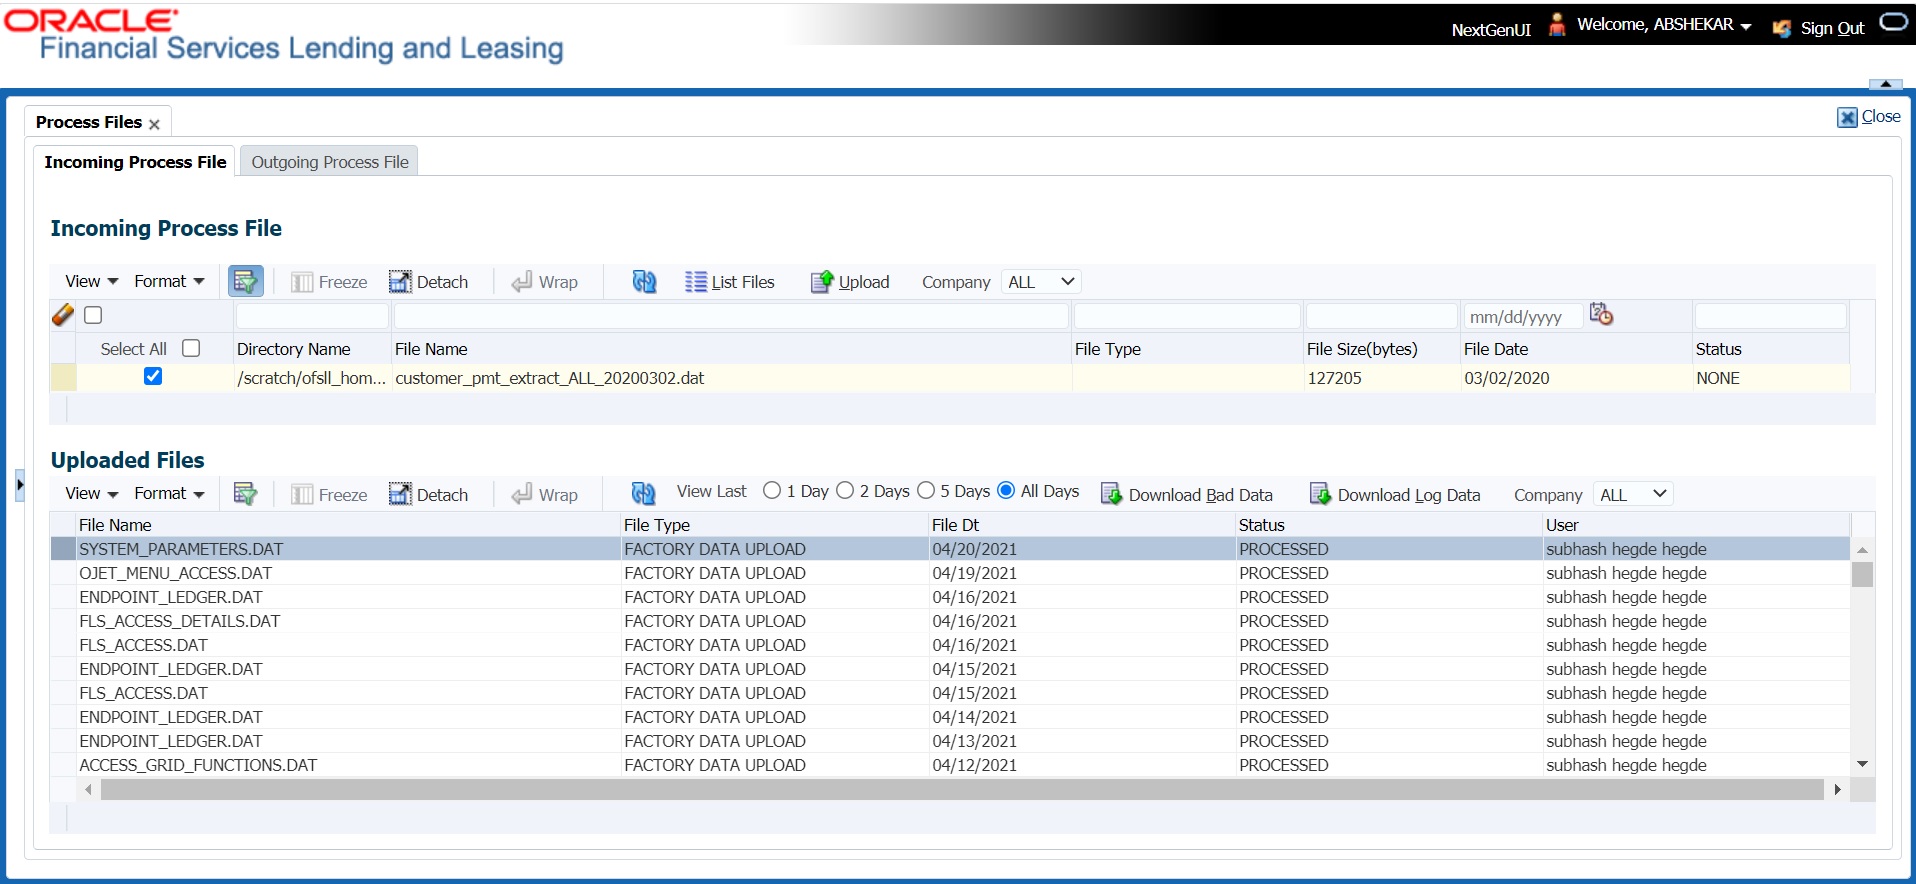
View the list Incoming Process File
- Click Dashboard > Process Files > Incoming Process File.
- In the Incoming Process File section, click List Files. System displays the list of incoming files.
A brief description of the fields is given below:
Field: |
Description: |
Select All |
Select this option to select all the listed files. |
Directory Name |
View the directory path where incoming file is stored. |
File Name |
View the name of the file. |
File Type |
View the type of incoming file. The file type is auto populated based on ODD (Output Data Definition) details maintained for the specific file type in INCOMING_FILE_TYPE_CD lookup. |
File Size(bytes) |
View the size of incoming file. |
File Date |
View the date and time when the incoming file was placed in the directory. |
Status |
View the status of the file. |
Upload Incoming Process File
- Click Dashboard > Process Files > Incoming Process File.
- In the Incoming Process File section, click List Files. System displays the list of incoming files. You can click
 to refresh the grid data.
- In the Company drop-down list, select the portfolio company. Based on the Company selected, system processes Incoming files. If the company is selected is ALL, system processes the upload file related to any company.
However, the Company list is populated only with those Company Definitions to which you have been provisioned access. This company is considered if system is setup to process batch jobs at Company level. For more information, refer to ‘Appendix - Company Level GL Date Configuration’ section.
- Select the check box adjacent to the required file and click Upload. You can also click Select All check box to perform a bulk upload of all the listed files.
The uploaded files are listed in below ‘Uploaded Files’ section and the status of the files are changed from ‘Generated’ to ‘Uploaded’. In case of a processing error, the status of the file is indicated as ‘Processed Error’.
3.6.1.1 Uploaded Files
The uploaded files section displays the list of incoming files uploaded into the system. You can sort and view the list of files depending on the number of days based on Last 1 Day / 2 Days / 5 Days / All Days. You can click  to refresh the grid data.
On selection, you can view the following information:
Field: |
Description: |
File Name |
View the name of file uploaded. |
File Type |
View the type of file uploaded. |
File Dt |
View the date and time when the file was uploaded. |
Status |
View the status of upload. |
User |
View the login ID of User who performed the file upload. |
In the Uploaded Files section, you can do the following:
- Click Download Bad Data to download the list of uploaded files which had processing errors due to bad data.
- Click Download Log Data to download a log of all the files uploaded.
- Sort the list of uploaded files based on specific company by selecting the same from ‘Company’ drop-down list.
3.6.2 Proration of Future Account Dues
OFSLL has a facility to derive future dated dues on an account using the input file processing mechanism. This helps to view the future dues on accounts in bulk even before posting on the account and without generating a mock statement on the account.
Similar to other input files processing, the required Account numbers and ‘Due Dates’ on which the due is to be calculated are to be added as individual record in the file and uploaded into the system by placing in input folder path. For more information on this process, refer to above section.
The Input file is processed in the system on running the batch job IADPRC_BJ_100_01 (ACCOUNT DUES FILE UPLOAD) in SET-IFP batch job set and to the location as per the system parameter CMN_FILE_PROCESS_TO_LOB value.
Using an internal function, system calculates the future dated due for the specific Account(s) and stores the computed values in database table. The same has to be queried to view the details. The due amount returned by this function is the regular bill amount calculated without considering any other outstanding dues. This is the proration amount that is posted on the same account before the next due is generated.
Note that, only ACTIVE status accounts are processed. Else system displays an error indicating ‘Invalid Account Status’.
3.6.3 Outgoing Process File
The outgoing process file section displays the list of files being shared for upload to other system for processing and allows you to download the required file for inspection.

You can sort and view the list of files depending on the number of days based on Last 1 Day / 2 Days / 5 Days / All Days.
On selection, you can view the following information:
Field: |
Description: |
Select All |
Select this option to select all the listed files. |
File Name |
View the name of upload file. |
File Type |
View the type of file shared for upload. The file type is auto populated based on ODD (Output Data Definition) details maintained for the specific file type in OUTGOING_FILE_TYPE_CD lookup. |
File Date |
View the date and time when the file was shared for upload. |
File Size(bytes) |
View the size of upload file. |
Status |
View the status of upload file. |
Download Outgoing Process File
- Click Dashboard > Process Files > Outgoing Process File.
System displays the list of files shared for upload. You can click  to refresh the grid data.
- In the Company drop-down list, select the portfolio company. Based on the Company selected, system processes Incoming files. If the company is selected is ALL, system processes the download file related to any company.
However, the Company list is populated only with those Company Definitions to which you have been provisioned access. This company is considered if system is setup to process batch jobs at Company level. For more information, refer to ‘Appendix - Company Level GL Date Configuration’ section.
- Select the check box adjacent to the required file and click Download. You can also click Select All check box to download all the listed files.
History
The history section displays the following details:
Field: |
Description: |
User |
View the login ID of User who downloaded the file. |
Download Dt |
View the date and time when the file was downloaded. |