Customer Graphical Overview
OIPA provides a graphical overview of Group Customer data on the Customer Overview screen, in addition to the traditional table view. The graphical view displays standard information regarding the Group Customer. At this time, the graphical display is not configurable. The traditional table view remains configurable. The user can toggle back and forth between the traditional (table) and the graphical (dashboard) views. The graphical display will show by default.
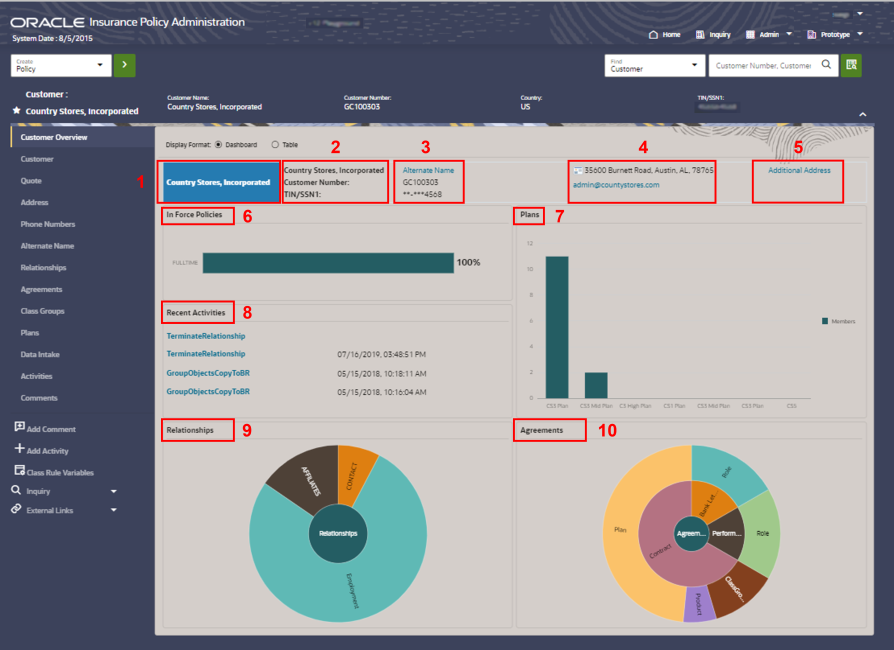
Customer Overview Screen displays the following contents. Refer Fig Graphical Customer Overview Layout for a better understanding of each point.
- Company Name (1) will be displayed on top left section of the screen.
- Company Name, Customer Number and Tax ID (2)
- Link to Alternate Names screen (3)
- Contact information, Default Address, email address (4)
- Link to Addresses screen (5)
- Inforce Policy count (6) displays the split of Active policies between enrollment relationship types. For example, Full Time and Part Time employees. Note, it will only take into account policies that are Active as of the system date and then calculate the percentage owned by each enrollment relationship type.
- Plans (7) displays the top 10 plans, based on membership totals, offered by this Group Customer. When the user hovers over the Plan/bar they will be presented with the name of the Plan, its effective date and the number of members in the plan.
- Recent Activities (8) displays the last 4 processed activities with effective date/timestamp. The user can click on the Activity Name link to navigate to the Activities screen for more information.
- Relationships (9) displays the Relationships types associated to the Group Customer. The information is displayed in a sunburst chart. When the user hovers over first layer (center) total number of Relationships is displayed. The outer layer displays each Relationship type associated to the Group Customer. When the user hovers over each type/section the applicable Relationship name as well as the number of pending and active records is displayed.
- Agreement (10) displays the Agreements associated to the Group Customer. The information is displayed in a sunburst chart. When the user hovers over the first layer (center), the total number of Agreements is displayed. The second layer displays each Agreement type associated to the Group Customer. When the user hovers over each type/section the Agreement name as well as the number of pending and active records is displayed. The third layer displays the entities associated with each Agreement type. When the user hovers over each entity/section the entity name as well as the number of pending and active records is displayed.