Resource Stacked Histogram
Description
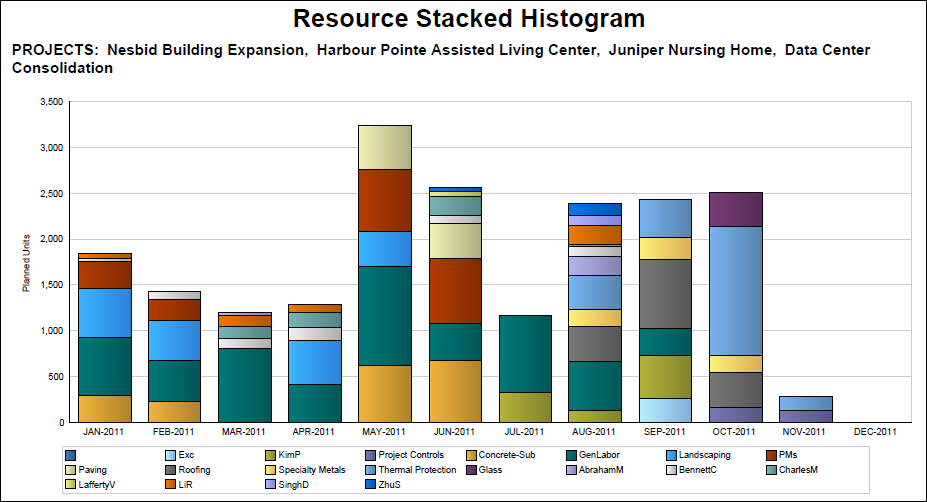
Displays a stacked histogram that shows effort as Planned Units (in hours) for selected resources, stacking bars by resource within the start and end date ranges.
Location
- Click Reports.
- On the Report page:
- Click the Reports tab.
- Expand the P6Reports folder.
- Expand the Resource folder.
- Click Resource Stacked Histogram.
Last Published Thursday, October 12, 2023