Working with the Capacity Planning Page
Use the Capacity Planning page to perform What-if analysis, graphically change project forecast dates, and apply waterline analysis techniques to assist with critical, executive-level decision making. Before assessing capacity or demand on roles, create role estimates for each project. After conducting your analysis, you can create new portfolios containing only the projects that meet your planning criteria.
When you choose to display a stacked histogram, area chart, or spreadsheet, the Capacity Planning chart displays the total at completion units or costs over time for the combination of selected roles and projects. Each of these charts contains the same information in different formats with a data stacking option for the projects and roles you select.
When you choose to display a net availability chart, the chart displays underallocated or overallocated units for each selected role over time for the currently selected projects. The limit line is always placed at zero. If the total units for a role equals the limit, no bar is displayed for that role. Bars placed above the limit line indicate net under-allocation for the associated role during the displayed time period; bars placed below the limit line indicate net over-allocation for the associated role during the displayed time period.
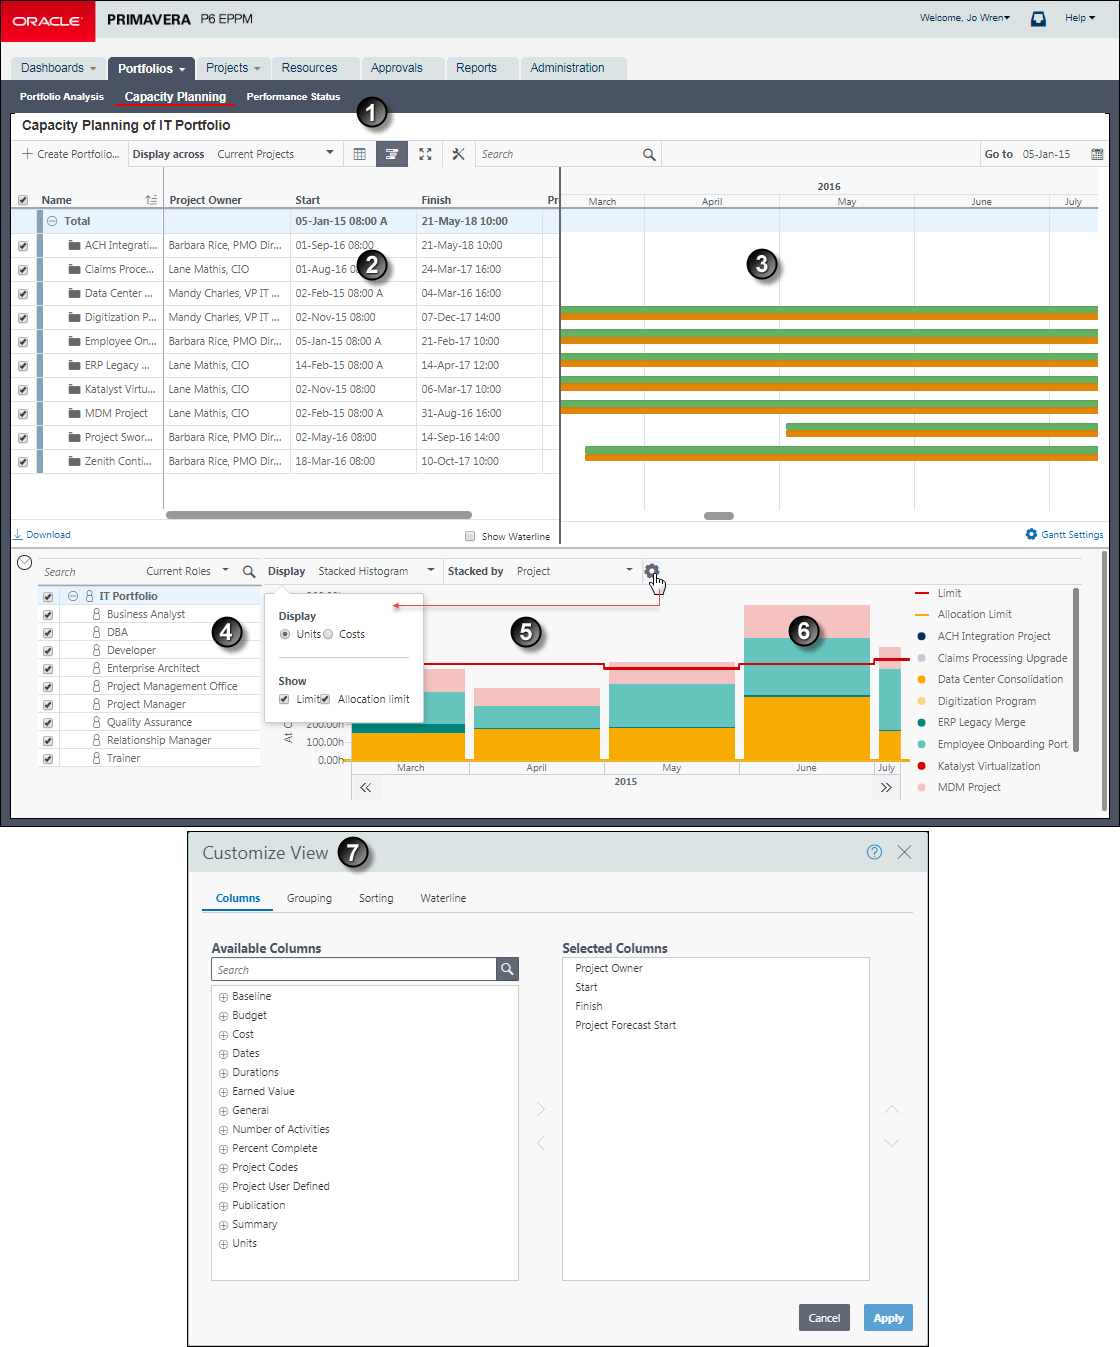
Table of Key Capacity Planning Page Elements
Item | Description |
|---|---|
| Navigation: Before you begin, first open the portfolio you want to work with, then select Capacity Planning. |
| Scorecard: Use this table to analyze, sort, and select projects. Only the projects you select in the option column appear in the Capacity Planning chart. Note: The scorecard on this page is not related to the set of defined portfolio view scorecards. |
| Gantt chart: View current and forecast schedules. Drag the bars to adjust the Capacity Planning chart data. |
| Role Selection Area: Select the options for the roles you want to include in the Capacity Planning chart. |
| Capacity Planning Chart (Under Allocated): View role allocation as a stacked histogram, area chart, net availability chart, or spreadsheet. |
| Capacity Planning Chart (Over Allocated): Customize the chart to show a limit line representing the maximum capacity of the currently selected roles by timescale period. |
| Customize Capacity Planning Chart: Customize the columns, grouping, waterline, or chart options. |
Note: The net availability charts are often the best place to begin a resource capacity or demand analysis since they represent a streamlined birds-eye view. These charts include all related projects and roles in a single view allowing you to expand or drill down into only the roles with perceived problems.
Related Topics
Last Published Wednesday, July 10, 2024