Working with Project Risks
The risk register on the Risks page is the main area of the application where you identify and manage risks for a project. Additionally, you can add risks to a project from the EPS page, and add risks to a project and assign the risks to activities from the Activities page.
Once you add a risk to the risk register, you can perform further analysis on the risk and create one or more risk response plans which include activities to reduce the negative impact of the risk.
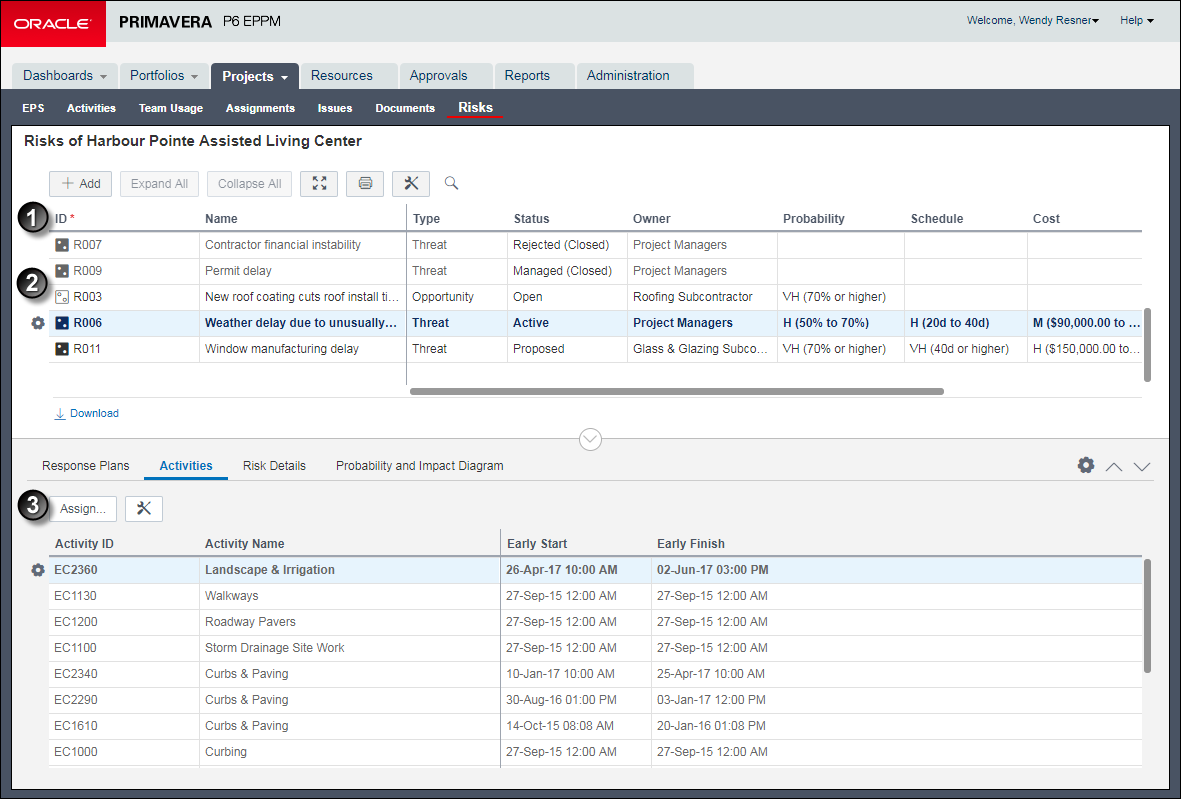
Table of Project Risks Elements
Item | Description |
|---|---|
| Risks register: : Risks for all the projects you have open display in the risk register. You can group by field name, such as project name, to view all risks organized by project, or create a filter to view only the risks that interest you. When adding a risk to the risk register, you supply a name for the risk, identify the risk as a threat or an opportunity, identify the current status of the risk, identify the owner of the risk, and then assign the values for probability, schedule, cost, and any other applicable user-defined impacts. The values for probability, schedule, cost, and additional user-defined impacts are used to calculate the risk score. The values for probability and cost are used to calculate risk exposure. Note: If the Probability, Cost, and Schedule fields are disabled, a risk scorning matrix has not been assigned to the project. You can still use the risk register to track your risks; however, you cannot use the qualitative risk analysis features in the application until you create a risk scoring matrix and assign it to the project. |
| Risks and Opportunities: The risk register can show both risks and opportunties. A Risk usually has a negative impact on a project. An Opportunity usually has a positive impact. |
| Risks detail windows: Response Plans: The area where you add response plans and response plan action items. Activities: The area where you associate scheduled activities in your project to an identified risk. Refer to the example above to see a list of the project activities impacted by risk R001: Concrete supply constrained. Risk Details: The area used to provide a detailed explanation of the risk, explain why this risk is occurring, and describe the impact this risk has on this project. Probability and Impact Diagram: The Probability and Impact Diagram (PID) is a graphical representation of the probability and impact thresholds assigned to the risk scoring matrix associated with the project. |
Related Topics
Last Published Wednesday, July 10, 2024