This section provides an overview of the OFSCA performance monitoring dashboard, including its components and functionalities.
This section describes the components available in the OFSCA performance monitoring dashboard.
To access the Transaction Monitoring Performance dashboard, follow these steps:
1. Click Open Ask Oracle ![]() to display the Ask Oracle window.
The following window is displayed.
to display the Ask Oracle window.
The following window is displayed.
Figure: Application Menu

2. Click Transaction Monitoring Performance menu to display the Transaction Monitoring Performance dashboard window. The following window is displayed.
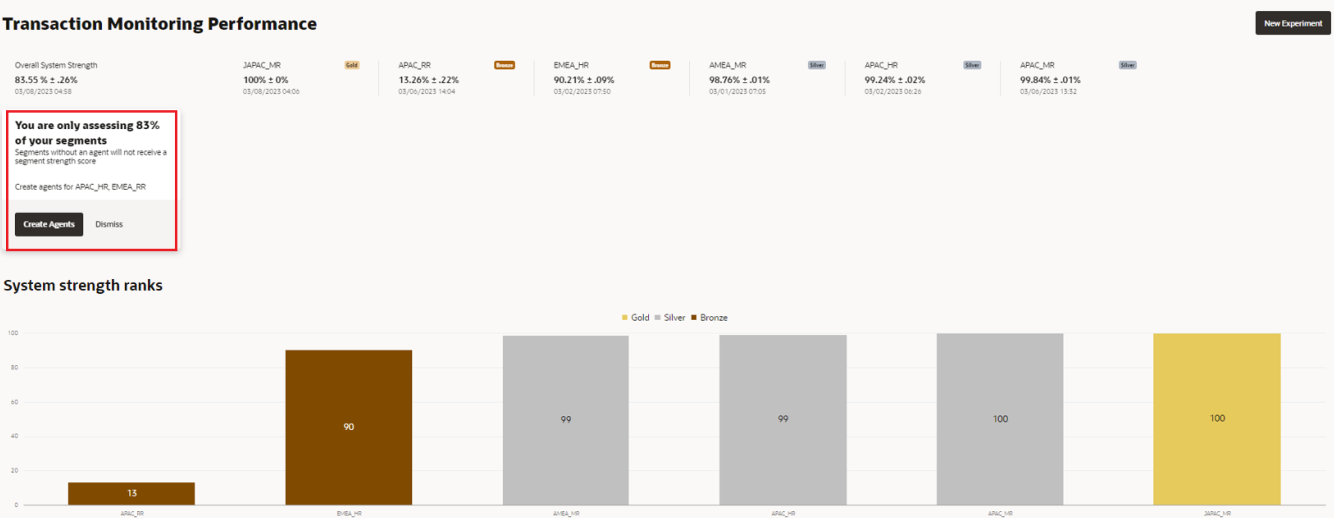
Figure: Transaction Monitoring Performance
![]()
This metric, displayed on the Overall System Strength component of the Transaction Monitoring System, indicates the general strength of your institution's segments, with higher values being more desirable than lower ones:
· Overall System Strength: Displays the overall strength of the Transaction Monitoring System across all of your institution's segments. For this metric, a higher value is preferable to a lower value.
Figure: Overall System Strength

· Individual Segment Strength: Displays the strength of each individual segment.
Figure: Individual Segment Strength

· System Strength ranks: The System Strength Ranks component displays each segment's strength and confidence rankings, which can be viewed by hovering over the specific segment.
§ Based on the performance of the TMS for a given segment, it is categorized as follows:
o Gold: The segments in the top third in terms of performance are in the Gold category.
o Silver: The segments in the middle third in terms of performance are in the Silver category.
o Bronze: The segments in the bottom third in terms of performance are in the Bronze category.
Ideally, the segments that are considered high risk by an institution should be in the gold category, while segments that are low risk can be in the bronze or silver category.
Figure: System Strength ranks

· System Insights: Displays the overall system level insights.
Figure: System Insights

§ <(ML/AC) CIB: High Risk Geography Activity> is the lowest performing scenario: The system highlights the scenario with the lowest performance and identifies the segments that require attention. We recommend addressing this scenario in the listed segments. Access the dashboard for the respective segment by clicking the hyperlink provided.
§ <RBR> is the most vulnerable account: The system highlights the most susceptible account type and identifies the segments where the account type is most vulnerable. We recommend addressing any monitoring gaps related to this account type in the listed segments. Access the dashboard for these segments by clicking on the provided hyperlink.
§ <WIRE> is the most vulnerable channel: The system highlights the most vulnerable communication channel and identifies the segments where the channel is at the highest vulnerable. We recommend addressing any monitoring gaps related to this channel in the listed segments. Access the dashboard for this segment by clicking on the provided hyperlink.
· New Experiment: You can create a new user defined experiment. For more information, see the User Defined Experiment section.
Figure: New Experiment

· Create Agents: You can create an agent for the segments which is not created during the initial configuration. For more information, see the Creating an Agent section.
Figure: Create Agents
You can view the individual segment dashboard as follows:
1. Click on the individual segment <APAC_MR> at the top of the dashboard to view the individual segment dashboard. The following window is displayed.
Figure: Segment Dashboard

The segment dashboard contains the following:
§ Scenario Performance: The scenario performance metric measures the level of resistance provided by scenarios against an intelligent adversarial agent. A high value of the performance metric indicates significant resistance offered by the scenario, which alerts on any attempts to move money through your institution by the agent.
Based on performance, the scenarios are bucketed into three categories as follows:
o Gold: The scenarios in the top third in terms of performance are in the Gold category.
o Silver: The scenarios in the middle third in terms of performance are in the Silver category.
o Bronze: The scenarios in the bottom third in terms of performance are in the Bronze category.
Tuning one of the low performing scenarios in the Bronze category is one way to improve performance of the segment.
§ Account Vulnerability: The account vulnerability metric identifies the account types most susceptible to exploitation by an intelligent agent to transact money through your financial system. A high value for this metric indicates that the agent prefers this specific account type while moving money through your institution.
Tuning scenarios and implementing controls that monitor this account type is recommended to address any gaps in your transaction monitoring system.
§ Channel Vulnerability: The channel vulnerability metric identifies the channels most susceptible to exploitation by an intelligent agent to transact money through your financial system. A high value for this metric indicates that the channel is the preferred instrument the agent uses to move money through your institution.
Tuning scenarios and implementing controls that monitor this specific channel is recommended to address any shortcomings in your transaction monitoring system.
For more information about Recommendations to increase segment strength, see the Generating Experiment from Recommendation section.
For more information on these metrics, see the Understanding the OFSCA Metrics section.