3.1.4 評価
新しいデータでモデルを使用して予測を行う前に、まずモデルの精度を評価する必要があります。 様々なメソッドを使用してモデルを評価できます。
モデル精度の表示
モデルの精度を確認するために、混同行列を使用します。 混同行列は、各クラスの正しいモデル予測と誤った予測を示す表です。 混同行列を作成した後、正しい予測の数を予測の合計数で除算して、モデルの精度を計算します。
CMATRIX <- with(RES, table(AFFINITY_CARD, PREDICTION))

CMATRIX

              PREDICTION
AFFINITY_CARD    0    1
            0 1206  145
            1  180  269
モデルの精度を表示するには、次の文を実行します:
ACCURACY <- CMATRIX / sum(CMATRIX)
round(sum(diag(ACCURACY)),3)*100

83.6
混同行列の結果は、テスト・セットの精度が83.6%であることを示しています
予測結果の表示
ここでは、予測結果を表示します。
- 予測結果を表示するには、次のコードを実行します:
z.show(ore.sort(RES[(RES$"'1'" > 0.5),], by = c("'1'")))
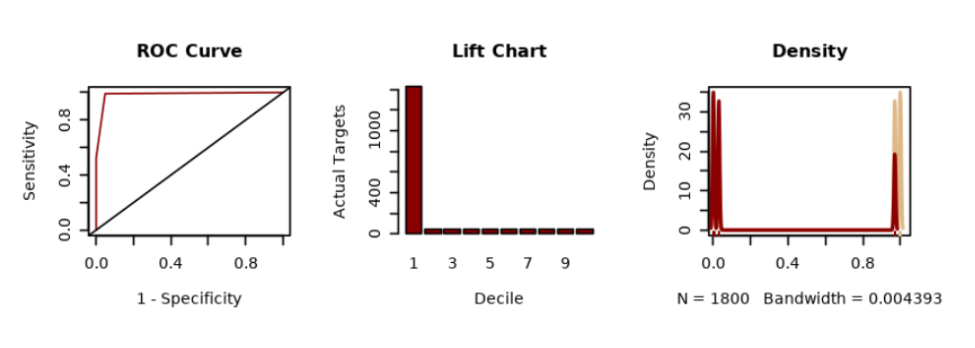
- ROC曲線、リフト・チャートおよび分布チャートを使用して予測結果を表示するには、次のコードを実行します:
# BAR PLOT
res <- ore.pull(RES)
sensitivity <- res[order(res$"'1'",decreasing = TRUE), ]
sens <- sum(sensitivity$"'0'")/sum(sensitivity$"'0'") - cumsum(sensitivity$"'0'")/sum(sensitivity$"'0'")
spec <- cumsum(sensitivity$"'1'")/sum(sensitivity$"'1'")

# LIFT CHART
decile2 <- quantile(sensitivity$"'1'", probs = seq(.1, .9, by = .1))
df_sens <- as.data.frame(sensitivity$"'1'", col.names = c("sens"))
df_sens$decile = as.numeric(cut(1-cumsum(df_sens$sens), breaks=10))


# DISTRIBUTION CHART
dx <- density(res$"'0'")
dx2 <- density(res$"'1'")

# PLOTS 3x1
par(mfrow=c(3,3))
plot(1 - spec, sens, type = "l", col = "darkred", ylab = "Sensitivity", xlab = "1 - Specificity", main = 'ROC Curve')
abline(c(0,0),c(1,1))
paste("AUC: ", round(sum(spec*diff(c(0, 1 - sens))),3))

barplot(table(df_sens$decile), xlab = 'Decile', ylab = 'Actual Targets', main = 'Lift Chart', col = "darkred")

plot(dx, lwd = 2, col = "burlywood",
     main = "Density")
lines(dx2, lwd = 2, col = "darkred")
# Add the data-poins with noise in the X-axis
rug(jitter(res$"'0'"),col='burlywood')
rug(jitter(res$"'1'"),col='darkred')
親トピック: 分類ユース・ケース