3.2.4 評価
新しいデータでモデルを使用して予測を行う前に、まずモデルの精度を評価する必要があります。 様々なメソッドを使用してモデルを評価できます。
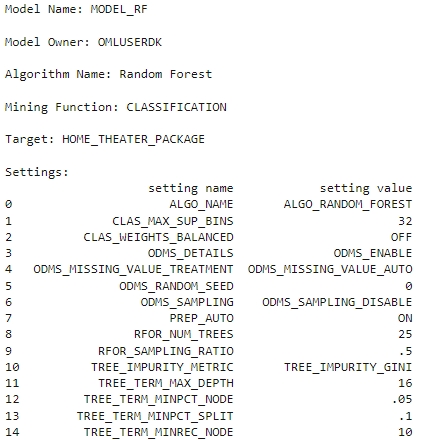
モデル設定に関する情報
モデルの構築後に生成された様々な統計を調べて、モデルを評価します。 統計はモデルの品質を示します。
- ランダム・フォレスト・モデル・オブジェクトを介して使用可能なモデル詳細(モデル設定、係数、適合詳細など)については、次のスクリプトを実行します。
rf_mod
また、次に示すように個別に表示および表示できます。
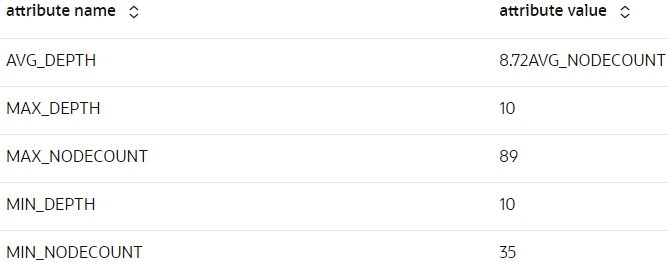
- 次のスクリプトを実行して、モデルのグローバル統計を表示します。
z.show(rf_mod.global_stats)
- 次のスクリプトを実行して、
rf_modモデルの属性重要度を表示します。z.show(rf_mod.importance)
スコア
ここでは、モデルを使用してテスト・ケースを予測し、混同行列、リフト・チャート、ゲイン・チャート、ROCカーブ・チャートなどのメソッドを使用してモデルを評価します。
- テスト・データに対して予測を行い、CASE_IDをサプリメンタル列として追加することで、スコアを元のデータに一意に関連付けることができます。 これを行うには、次のスクリプトを実行します:
# Set the case ID attribute case_id = 'CUST_ID' # Gather the Predictions RES_DF = rf_mod.predict(TEST_X, supplemental_cols = TEST_X) # Additionally collect the PROBABILITY_OF_0 and PROBABILITY_OF_1 RES_PROB = rf_mod.predict_proba(TEST_X, supplemental_cols = TEST_X[case_id]) # Join the entire result into RES_DF RES_DF = RES_DF.merge(RES_PROB, how = "inner", on = case_id, suffixes = ["", ""]) -
モデルを評価するには、予測を含むプロキシ・オブジェクト
oml.Dataframeと、ユーザー定義関数evaluate_model内のターゲット列を渡します。 標準メトリックを使用してモデルを評価します。 分類の例では、次のものを使用してモデルを評価できます:- 混同行列: テスト・データの実際の分類に関して行われた正しい予測と間違った予測の数とタイプが表示されます。 n-by-n行列で、nはクラスの数です。
- リフト・チャート: 正のクラスの指定を必要とするバイナリ分類にのみ適用されます。 分類モデルの予測がランダムに生成された予測よりも優れている程度を測定します。
- ROC曲線グラフ: 2進分類に適用され、正のクラスの指定が必要です。 これらは、分類モデルの予測ターゲット値と実績ターゲット値を比較するためのメトリックです。
次のスクリプトを実行して、メトリックおよびチャートを生成します:
def evaluate_model(pred_data='', settings_name={''}, name='', target=''):
    """Evaluate the models by passing an proxy oml.Dataframe containing Predictions
    and the target column,
    The Settings name (for the charts),
    The name of the model used (for the charts),
    Supply the target column name for evaluation
    for computing the confusion matrix with the test dataset"""
    import oml
    import numpy as np
    import matplotlib.pyplot as plt
    from sklearn.metrics import auc
    from sklearn.metrics import roc_curve

    conf_matrix = pred_data.crosstab(target,'PREDICTION',pivot=True)

    # Extract Statistics from the Confusion Matrix
    cf_local = conf_matrix.pull()
    TN = int(cf_local[cf_local[target]==0]['count_(0)'])
    FN = int(cf_local[cf_local[target]==0]['count_(1)'])
    TP = int(cf_local[cf_local[target]==1]['count_(1)'])
    FP = int(cf_local[cf_local[target]==1]['count_(0)'])
    TPR = TP/(TP+FN)
    FPR = FP/(FP+TN)
    TNR = TN/(TN+FP)
    FNR = FN/(FN+TP)
    Precision = TP/(TP+FP)
    Accuracy = (TP+TN)/(TP+TN+FP+FN)
    NPV = TN/(FN+TN)
    DetectionRate = TN/(FN+TN)
    BalancedAccuracy = (TPR+TNR)/2

    # Estimated AUC via Triangle (not very precise) could be
    # AUC = (1/2)*FPR*TPR + (1/2)*(1-FPR)*(1-TPR) + (1-FPR)*TPR
    # Compute real AUC using roc_curve by loading the
    # data locally and using the roc_curve() function
    pred_local = pred_data.pull()
    fpr, tpr, _ = roc_curve(pred_local[[target]],pred_local[['PROBABILITY_OF_1']])
    AUC = auc(fpr, tpr)
    opt_index = np.argmax(tpr - fpr)
    FPR_OPT = fpr[opt_index]
    TPR_OPT = tpr[opt_index]
    F1Score = 2*Precision*TPR/(Precision+TPR)
    MathewsCorrCoef = ((TP*TN)-(FP*FN))/((TP+FP)*(TP+FN)*(TN+FP)*(TN+FN))**0.5

    # Store all statistics to export
    statistics = {'Algorithm' : name,
                'Algorithm_setting' : settings_name,
                'TN' : TN,
                'TP' : TP,
                'FP' : FP,
                'FN' : FN,
                'TPR' : TPR,
                'FPR' : FPR,
                'TNR' : TNR,
                'FNR' : FNR,
                'Precision' : Precision,
                'Accuracy' : Accuracy,
                'NPV' : NPV,
                'DetectionRate' : DetectionRate,
                'BalancedAccuracy' : BalancedAccuracy,
                'AUC' : AUC,
                'F1Score' : F1Score,
                'MathewsCorrCoef' : MathewsCorrCoef
                }
    # Nice round stats for printing to screen
    TOTAL = TP+TN+FP+FN
    TN_P = round((TN/TOTAL*100),2)
    FP_P = round((FP/TOTAL*100),2)
    FN_P = round((FN/TOTAL*100),2)
    TP_P = round((TP/TOTAL*100),2)
    # Print the output nicely on Zeppelin native Table
    print("%table CONFUSION MATRIX\tPREDICTED 0\tPREDICTED 1\nACTUAL 0\t"+
        "True Negative: "+str(TN)+" ("+str(TN_P)+"%)\t"+
        "False Positive: "+str(FP)+" ("+str(FP_P)+"%)\nACTUAL 1\t"+
        "False Negative: "+str(FN)+" ("+str(FN_P)+"%)\t"+
        "True Positive: "+str(TP)+" ("+str(TP_P)+"%)\n"+
        "Accuracy: "+str(round(Accuracy*100,4))+"%\t"+
        "AUC: "+str(round(AUC,4))+"\t"+
        "F1Score: "+str(round(F1Score,4))
        )

    # Multiple Charts for Evaluation
    fig, axes = plt.subplots(nrows=1, ncols=4,figsize=[22,5])
    ax1, ax2, ax3, ax4 = axes.flatten()
    fig.suptitle('Evaluation of the '+str(name)+' Model, with settings: '+str(settings_name), size=16)

    # Statistics
    ax1.axis('off')

    # Function to return rounded numbers if the string is float, return
    # integers otherwise and return characters if not a number
    def round_if_float(content):
        try:
            val = float(content)
        except ValueError:
            return(content)
        else:
            if val.is_integer():
                return(int(content))
            else:
                return(round(float(content),4))

    for num, name in enumerate(statistics):
        ax1.text(0.01,
        (-num*0.06+0.94),
        "{0}: {1}".format(name,round_if_float(statistics[name])),
        ha='left',
        va='bottom',
        fontsize=12)

    # Produce Lift Chart
    ax2.set_title('Lift Chart')
    data = pred_local.sort_values(by='PROBABILITY_OF_1', ascending=False)
    data['row_id'] = range(0,0+len(data))
    data['decile'] = ( data['row_id'] / (len(data)/10) ).astype(int)
    lift = data.groupby('decile')[target].agg(['count','sum'])
    lift.columns = ['count', target]
    lift['decile'] = range(1,11)

    data_ideal = pred_local.sort_values(by=target, ascending=False)
    data_ideal['row_id'] = range(0,0+len(data))
    data_ideal['decile'] = ( data_ideal['row_id'] / (len(data_ideal)/10) ).astype(int)
    lift_ideal = data_ideal.groupby('decile')[target].agg(['count','sum'])
    lift_ideal.columns = ['count', 'IDEAL']
    lift['IDEAL']=lift_ideal['IDEAL']

    ax2.bar(lift['decile'],lift['IDEAL']/lift['count'],
    color='darkorange', label='Ideal')
    ax2.bar(lift['decile'],lift[target]/lift['count'],
    color='blue', alpha=0.6, label='Model')
    ax2.axhline((lift[target]/lift['count']).mean(),
    color='grey', linestyle='--', label='Avg TARGET')
    ax2.set_ylim(0,1.15)
    ax2.set_xlabel('Decile', size=13)
    ax2.set_ylabel('Percent of Actual Targets', size=13)
    # Print labels.
    for dec in lift['decile']:
        ax2.text(dec, lift[lift.decile==dec][target]/lift[lift.decile==dec]['count'] + 0.05,
        ("%.0f" % int(round((lift[(lift.decile==dec)][target]/lift[lift.decile==dec]['count'])*100,0)))+"%",
        ha='center', va='bottom')
    ax2.legend(loc="upper right")

    # Produce Gains Chart
    ax3.set_title('Distributions of Predictions')
    pred_local[pred_local[target]==1]['PROBABILITY_OF_1'].rename("Target = 1").plot(kind='density', bw_method=0.1, grid=True, ax=ax3)
    pred_local[pred_local[target]==0]['PROBABILITY_OF_1'].rename("Target = 0").plot(kind='density', bw_method=0.1, grid=True, ax=ax3)
    ax3.axvline(.5, color='grey', linestyle='--', label='Cutoff at 0.5')
    ax3.set_xlim([0,1])
    ax3.set_xlabel('Probability of 1', size=13)
    ax3.set_ylabel('Density', size=13)
    ax3.legend(loc="upper right")

    # ROC curve Chart
    ax4.set_title('ROC Curve')
    ax4.plot(fpr, tpr, color='blue', lw=2, label='ROC curve')
    ax4.plot(FPR_OPT, TPR_OPT,  color='orange', markersize=6)
    ax4.plot([0, 1], [0, 1], lw=2, linestyle='--', color='grey', label='Random guess')
    ax4.annotate('Optimal Cutoff:\nTPR: '+str(round(TPR_OPT,2))+' FPR: '+str(round(FPR_OPT,2)),
                fontsize=11, xy=(FPR_OPT, TPR_OPT), xycoords='data', xytext=(0.98, 0.54),
                textcoords='data',
                arrowprops=dict(facecolor='gray', shrink=0.1, width=2,
                                connectionstyle='arc3, rad=0.3'),
                horizontalalignment='right', verticalalignment='top')
    ax4.annotate('AUC ='+str(round(AUC,4)), xy=(0.5, 0.35),
                xycoords='axes fraction', size=13)
    ax4.annotate('Precision ='+str(round(Precision,4)), xy=(0.45, 0.3),
                xycoords='axes fraction', size=13)
    ax4.annotate('Recall ='+str(round(TPR,4)), xy=(0.4, 0.25),
                xycoords='axes fraction', size=13)
    ax4.annotate('Accuracy ='+str(round(Accuracy,4)), xy=(0.35, 0.2),
                xycoords='axes fraction', size=13)
    ax4.annotate('F1 Score ='+str(round(F1Score,4)), xy=(0.3, 0.15),
                xycoords='axes fraction', size=13)
    ax4.set_xlim([-0.02, 1.02])
    ax4.set_ylim([0.0, 1.02])
    ax4.set_xlabel('False Positive Rate', size=13)
    ax4.set_ylabel('True Positive Rate', size=13)
    ax4.legend(loc="lower right")

    return(statistics, pred_local)

_ = evaluate_model(pred_data=RES_DF, settings_name='Num Trees:25,Sampling Ratio:0.5', name='Random Forest', target='HOME_THEATER_PACKAGE')

- 0.5より大きい確率でHOME_THEATER_PACKAGEに応答する顧客の結果を表示します。 表示する
RES_DFデータセットから列を選択します。 これを行うには、次のスクリプトを実行します:z.show(RES_DF[RES_DF['PROBABILITY_OF_1'] > 0.5])
- 次のスクリプトを実行して、
rf_modのモデル精度を取得します。 スコア関数は、テスト・データとターゲット・テスト・データを予測し、平均精度を提供します。print("RF accuracy score = {:.2f}".format(rf_mod.score(TEST_X, TEST_Y)))RF accuracy score = 0.680.68の精度を得るか、結果の約68%が正しく予測されます。
結論として、HOME_THEATER_PACKAGEを購入する見込みがある顧客の識別に成功しました。 この予測は、ターゲット顧客に対してホーム・シアター・パッケージを販促し、オファーするのに役立ちます。
親トピック: 分類ユース・ケース