Enabling a Performance Trace
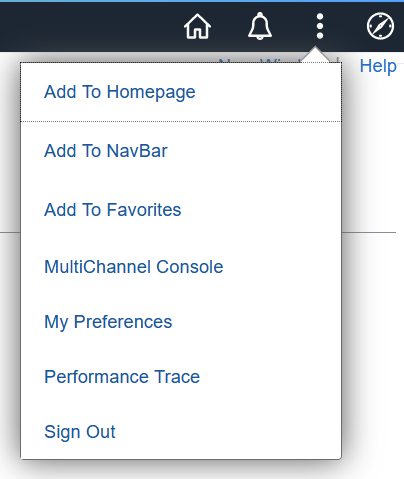
When PPM is enabled, both fluid and classic pages display the Performance Trace link, as part of the Actions menu. The Performance Trace link is not available in the fluid banner. However, for classic, you can set up the Performance Trace link to appear on the actions menu in the fluid-like portal header.
Note: In the following procedures, be sure to notice where each step needs to be completed: on the monitoring system or the monitored system.
To enable a performance trace:
On the monitoring system, select and then select the appropriate system definition.
On the monitoring system, make sure Allow Performance Trace is selected on the System Definitions page.
Note: If a business process includes multiple systems, each system in the business process needs to have the system configured to allow performance traces.
On the monitoring system, click Save and Notify Agents.
On the monitored system, make sure the users who will run the performance trace have the WEBLIB_PPM web library specified in at least one of their permission lists.
Note: If you don't want a user to see the Performance Trace link, you need to remove the web library WEBLIB_PPM from that user's permission lists. Without access to WEBLIB_PPM, the Performance Trace link does not appear in the actions menu.
To display Performance Trace link on the actions menu, complete the following steps on the monitored system:
Note: You must assign the Secure Branding Administrator role to the user ID that is used to log in to the system to perform this task.
On the monitored system, navigate to .
Select Search.
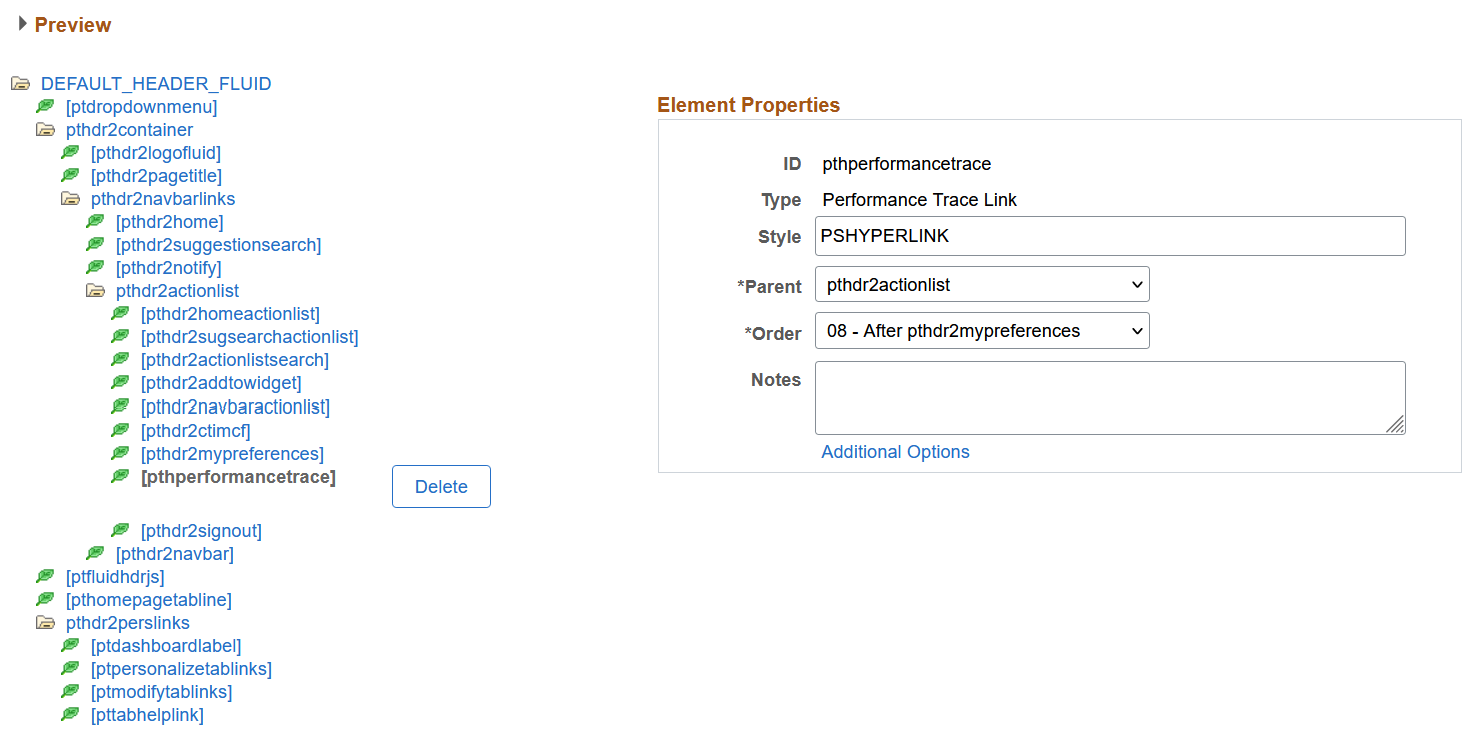
From the list of layouts, select DEFAULT_HEADER_FLUID.
In the tree structure, select the pthdr2actionlist element. This element represents the actions menu at the top right area of the banner.
Select the Add Child button.
On the Add Child Element dialog, enter an ID and in the Type field, select Performance Trace Link.
Select OK.
On the Additional Options dialog, select OK.
The new element is added to the tree structure.
In the Element Properties area, in the Order field, select 08 - After pthdr2mypreferences.
This step ensures that the Performance Trace link appears between the My Preferences and Sign Out links on the actions menu.
This example illustrates the newly added Performance Trace element.
Select Save and refresh the page.
This example illustrates the display of Performance Trace link in the actions menu.