Running a Performance Trace
The Performance Trace Console launches in a small, separate window.
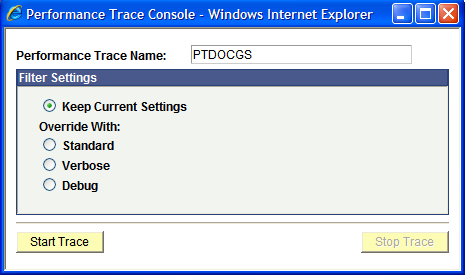
This example illustrates the fields and controls on the Performance Trace Console.
To run a performance trace:
If the Performance Trace link does not appear in the Universal Navigation Header, click Sign out to sign off the system, and then clear the browser's cache (remove temporary Internet files).
Note: Clearing browser cache varies depending on which supported browser you use. Refer to your browser's documentation for details.
Sign on to the PeopleSoft system.
Navigate to the page where you want to begin the performance trace.
Click the Performance Trace link, which is located in the Universal Navigation Header.
This launches the Performance Trace Console.
In the Performance Trace Name edit box, enter a name to identify the trace results.
Remember the name that you enter because you need to enter this name in the search criteria when you intend to view the trace results. You can accept the default name, if one appears.
In the Filter Level group box, set the filter level options.
You have the following options:
Field or Control
Description
Keep Current Settings
The system continues to record performance information according to the current agent filter settings.
Override With Standard
Changes the current filter level to Standard for the current user's session.
Override With Verbose
Changes the current filter level to Verbose for the current user's session.
Override With Debug
Changes the current filter level to Debug for the current user's session.
When the appropriate filter levels have been set, click Start Trace.
Complete the business process that you need to monitor.
Click Stop Trace.