2. PDP (Batch) Functionality
Performance Diagnostic Plugin (PDP-Batch) is a tool to capture the performance lag reports like TKPROF and Hierarchical profiling (HPROF) during batch processing in FCUBS.
Existing methods of capturing these reports at a very high level causing difficulties in analyzing the precise point of issue and involves DBA’s. PDP helps to get the report precisely at the issue level i.e., for a particular batch configured. This tool is applicable only for batch configured in EOC under POST stages.
Performance Diagnostic Plugin tool depends on the initial maintenance of the performance issue faced by the user to generate the performance bottleneck reports for analysis.
This section contains the following topics:
l Section 2.2.1, "Invoking PDP Maintenance Screen – Batch Processing"
l Section 2.2.1.1, "Viewing PDP Summary Screen – Batch"
2.2.1 Invoking PDP Maintenance Screen – Batch Processing
You can invoke the ‘Performance Diagnostic Plugin (Batch) Maintenance’ screen by typing ‘STDEDPDP’ in the field at the top right corner of the Application tool bar and clicking on the adjoining arrow button.
You specify the following fields:
Branch Code
Specify the Branch code details for branch facing the performance issue.
Branch Name
This displays the name of the Branch selected.
EOC Batch
Specify the EOC Batch that is causing the performance issue.
Batch Description
This displays the name of the Batch selected.
EOC Stage
Based on the Batch selected, the stage will be auto-populated.
Trace Value
Provides the options for users to choose the type of reports required for analysis. Below are the options to choose from:
|
UI Option Name |
Description |
|
Hierarchical Profiling (HPROF) File |
Hierarchical profiling (HPROF) file generation |
|
Trace (TKPROF) File |
Trace file generation |
Process No.
Specify the number of parallel processes maintained for the selected batch.
Note
This field is applicable only if the EOC Batch is selected as “CLBATCH” and hence is disabled by default. Field value is auto-populated as ‘0’ for all other batch’s except “CLBATCH”.
2.2.1.1 Viewing PDP Summary Screen – Batch
You can view the summary details of PDP in the ‘Performance Diagnostics Plugin (Batch) Summary’ screen. You can invoke this screen by typing ‘STSEDPDP’ in the field at the top right corner of the application tool bar and clicking on the adjoining arrow button.
_Summary00005.JPG)
In the Performance Diagnostics Plugin (Batch) Summary screen, you can base your queries on any or all of the following parameters and fetch the records:
l Authorization Status
l Record Status
l Branch Code
l EOC Stage
l EOC Batch
l Process No
l Trace Value
Click on the ‘Search’ button. The system identifies all records satisfying the specified criteria and displays the same.
After the maintenance in STDEDPDP, run EOC to capture the performance lag reports. Below sections, depict a sample performance issue faced during EOC process.
Problem Description:
Assume “ACCREVAL” is taking more time during its execution at Post End of Transaction Input (sub-stage 1) stage. In-order to analyze the issue, support team has requested user to share the HPROF.
Problem Simulation:
1. In order to capture the performance lag reports, user needs to maintain these details in system under STDEDPDP as specified under Section 2.2.1, "Invoking PDP Maintenance Screen – Batch Processing".
Branch Code : PD1
EOC Stage : Post End of Transaction Input 1
EOC Batch : ACCREVAL
Process No : 0
As per the requirement, user needs to capture HPROF; the trace value to select would be “Hierarchical Profiler (HPROF) File“.
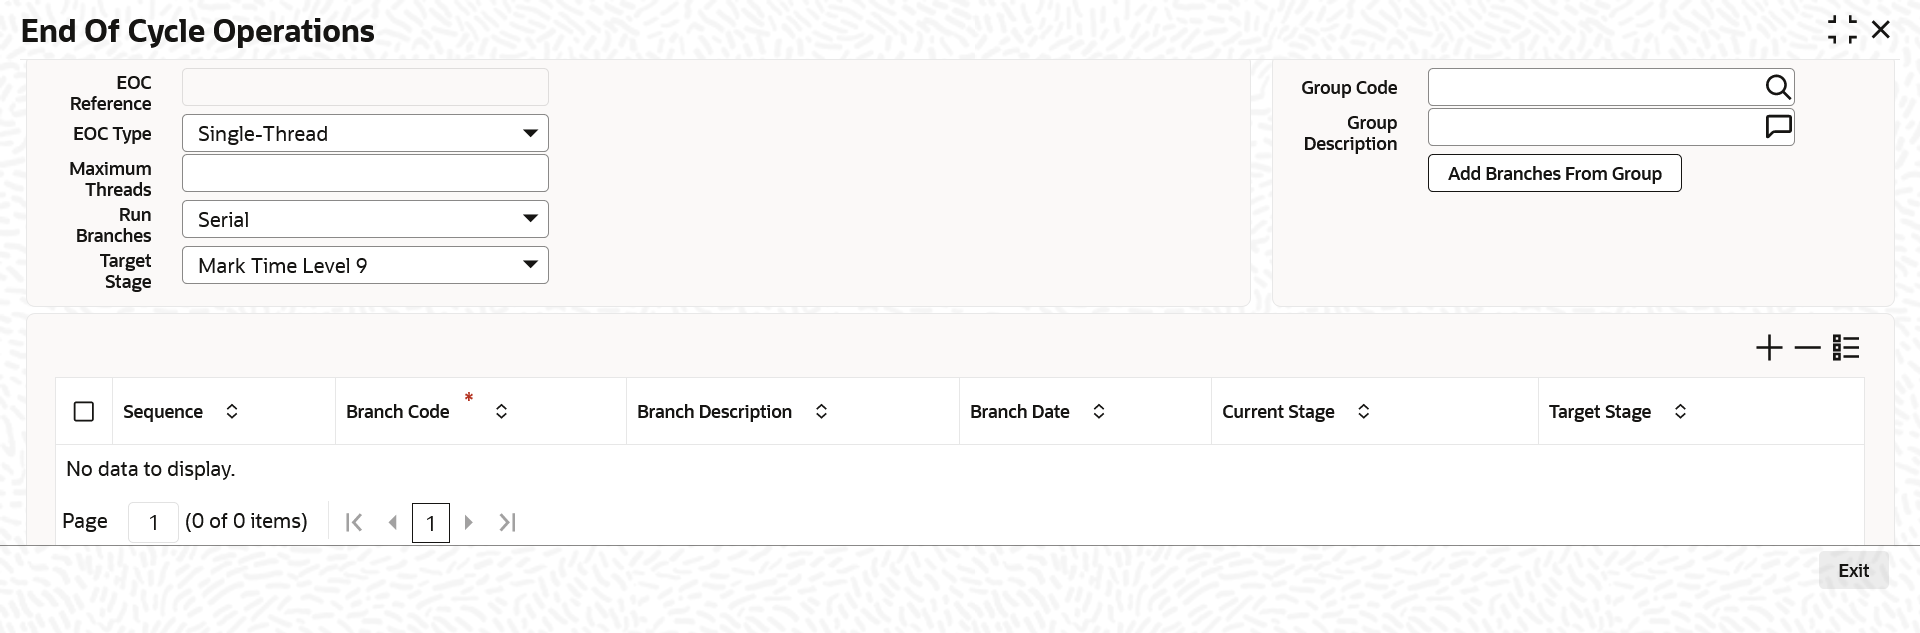
2. Once the above maintenance is completed, launch End Of Cycle Operations screen (AEDSTART), preform the EOC for branch “PD1”.
3. Due to the performance issue, batch execution might take some time and required performance lag report are captured into their respective folders as configured.
Results Captured:
l HPROF: During EOC, the system captures the HPROF file under database servers – WORK_AREA directory as configured under CSTB_PARAM. Below is the HPROF file captured that can be converted into human readable html file.

More details on the configuration of output directories are provides under Section 2.4, "Results"
Results captured by the system are subjected to the maintenance of Trace value. All files captured are placed under configured directories.
This section contains the following topics:
A Trace file is a file containing a trace of certain events that happen (or will happen) during the process. SQL trace files are more concentrated towards SQL queries taking more time during execution in database. Examining a raw trace file can be overwhelming. To gather useful information from it quickly, trace files are converted into a readable format that can be can easily interpreted.
Oracle Database provides a tool called tkprof for conversion of trace file into a more readable format file also referred as TKPROF file. PDP (Batch) functionality capture the trace file into the destination folder configured in init.ora file. Trace file path can also be obtained by value returned from query - SELECT VALUE FROM V$DIAG_INFO WHERE NAME = 'Default Trace File'. It is the responsibility of user/analyst to convert this trace file to TKPROF file for further analysis. Trace file generated by system is of below format.
<ORACLE_SID>_ora_<SERVER_PROCESSID>_<BRANCH_CODE>_<EOC_STAGE>_<EOC_BATCH>_<PROCESS_NO>.trc
Initial parts of the file name until server process id is Oracle defined naming convention based on the Database setup and later is PDP (Batch) defined naming convention. Conversion of trace file to TKPROF is achieved via below generic command. Please run the command in command prompt window.
Syntax:
TKPROF <PDP_GENERATED_TRACE_FILE><SPACE><USER_DEFINED_FILE_NAME>EXPLAIN=SCHEMA_USER/PASSWORD@HOST_NAME:PORT<SPACE>SORT=FCHELA,EXEELA,PRSELA<SPACE>WAITS=YES
Example
PDP generated trace file: DEV1900_ora_12349_PD1_POSTEOTI_1_ACCREVAL_0.trc
User desired TKPROF file: TKP_ PD1_POSTEOTI_1_ACCREVAL_0
TKPROF DEV1900_ora_12349_PD1_POSTEOTI_1_ACCREVAL_0.trc TKP_PD1_POSTEOTI_1_ACCREVAL_0 EXPLAIN=UBS141WLY/UBS141WLY@WHF00GJK.IN.ORACLE.COM:1521 SORT=FCHELA,EXEELA,PRSELA WAITS=YES
Hierarchical profiler (HPROF) is used to identify bottlenecks and performance-tuning opportunities in PL/SQL applications. HPROF is similar to trace files but is more concentrated towards PLSQL blocks to capture the timings during execution. This file reports the dynamic execution profile of your PL/SQL program, organized by sub program calls.
Similar to trace file, HPROF provides plshprof command-line utility to convert HPROF file into human-readable html format. HPROF generated by the system is of the below format, matching the PDP (Batch) naming convention standards. The generated file are under WORK_AREA path defined under CSTB_PARAM.
hprof_<BRANCH_CODE>_<EOC_STAGE>_<EOC_BATCH>_<PROCESS_NO>
Conversion of HPROF file to human readable html format achieved via below generic command. Please run in command prompt window.
Syntax:
PLSHPROF<SPACE> -OUTPUT<SPACE><USER_DEFINED_FILE_NAME><SPACE><PDP_GENERATED_HPROF_FILE>
Example:
PDP Generated HPROF file: hprof_PD1_POSTEOTI_1_ACCREVAL_0
User desired HPROF html file: hp_PD1_POSTEOTI_1_ACCREVAL_0.html
PLSHPROF -OUTPUT hp_PD1_POSTEOTI_1_ACCREVAL_0 hprof_PD1_POSTEOTI_1_ACCREVAL_0
Note
Below are some of the sample files attached for reference.
|
TKPROF |
TKP_AK1_POSTEOTI_1_CLBATCH_0.prf |
|---|---|
|
HPROF |
hp_PD1_POSTEOTI_1_ACCREVAL_0.html |