Monitoring Events
This section discusses how to monitor events.
|
Page Name |
Definition Name |
Usage |
|---|---|---|
|
EOEN_EVENT_MON |
Review the status of raised or processed business events and their associated event handler executions. |
|
|
EOEN_EVENT_MON2 |
Review the details of registered event-handler executions on the local node for a selected event instance. |
|
|
EOEN_EVENT_MON3 |
View the data, exceptions, and trace information that the selected event handler logged during execution and passed back to the Event Manager framework. |
Use the Event Manager - Monitor page (EOEN_EVENT_MON) to review the status of raised or processed business events and their associated event handler executions.
Navigation:
This example illustrates the fields and controls on the Event Manager - Monitor page. You can find definitions for the fields and controls later on this page.
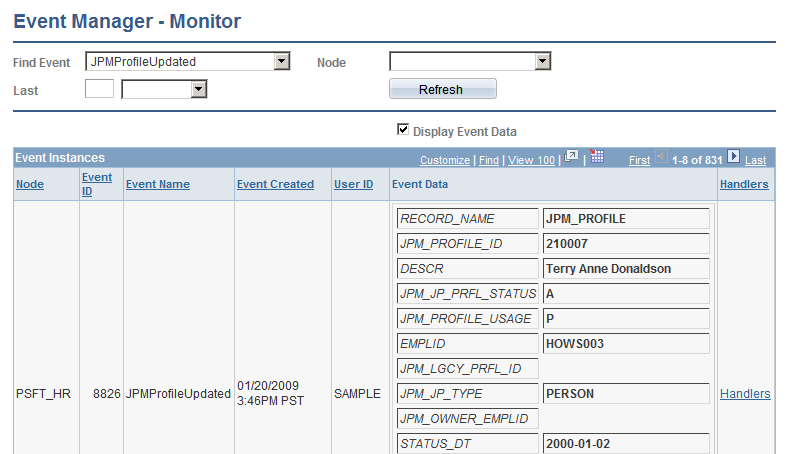
Search Criteria
Enter the search criteria for retrieving event instances. At a minimum, you must select at least one criterion to retrieve results. Use the remaining fields to narrow your search results.
Field or Control |
Description |
|---|---|
Find Event |
Select the event from the local Event Registry component for which you want to review event instances. |
Last |
Specify the time period in which the event was raised. For remote events, this is the time period in which the event appeared in the local node. In the first box, specify a numeric quantity. Then select a time qualifier: Days, Hours, or Minutes. |
Node |
Select a node name to limit the search results to event instances of raised events within a specific node. |
Refresh |
Click to refresh the list of event instances after changing any of the search criteria. |
Display Event Data |
Select to display the event data for each event instance. The system displays the Event Data column in the Event Instances grid. |
Event Instances
Review the logged event instances that meet your search criteria. The system displays instances for only the events and event handlers that you have configured in the local Event Registry component to be logged. You set the logging option for an event by selecting the Logging Enabled check box for an event on the Define Events page. Note that the process that raises the event waits for all registered synchronous event handlers to execute.
Field or Control |
Description |
|---|---|
Node |
The system displays the node from which the event instance was raised. |
Event ID |
The identification code of the event. The combination of this value and the node value uniquely identify the event instance on the originating node. |
Event Name |
The event name. |
Event Created |
The date and time that the event was raised in the source database (node). The system displays the time zone for this field because events could be raised in a node that operates in a time zone that differs from the local node. |
User ID |
The ID of the user that raised the event. This field is applicable only to event instances that are raised in the local database. |
Event Data |
The data for the event instance. To view the data, you must select the Display Event Data check box. |
Handlers |
Click this link for a specific event instance to access the Event Monitor - Handlers page, where you can view information about the registered event handlers that were executed on the local node for the selected event instance. |
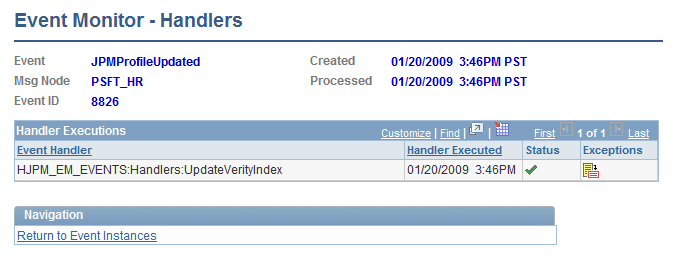
Use the Event Monitor - Handlers page (EOEN_EVENT_MON2) to review the details of registered event-handler executions on the local node for a selected event instance.
Navigation:
Click the Handlers link for an event instance on the Event Manager - Monitor page.
This example illustrates the fields and controls on the Event Monitor - Handlers page. You can find definitions for the fields and controls later on this page.
The system displays information for only the event handlers that you have configured to log executions. To log event handler executions, you must set the Logging option for a specific event handler and event combination on the Registered Handlers page.
The upper portion of the page displays information about the selected event instance that caused the event handler execution as well as the date and time that the local node began processing the event. For local events, the Processed date and time is generally the same as the date and time that the event was created. For remote events, the Processed date and time indicates when the local node received notification of the remote event from PeopleTools Integration Broker.
Handler Execution
This grid lists the event handlers that the system executed on the local database in response to the selected event instance.
If no event handler execution information is available, the system displays an informative message that indicates the possible reasons why no information is available. Possible reasons are that no event handlers are registered for the selected event, no event handlers are configured to log execution for the selected event, no synchronous event handlers are registered for the selected event and PeopleTools Integration Broker has not yet executed any asynchronous event handlers, or no event handlers executed for the event.
Field or Control |
Description |
|---|---|
Event Handler |
The system displays the full path of the application class that implements the event handler. |
Handler Executed |
The system displays the date and time that the system executed the event handler. |
|
The system displays the event instance data. |
|
The system displays information about the event handler exceptions. |
|
The system displays the event handler exception warnings. |
|
The system displays the event handler exception errors. |
|
The system displays event-handler trace information. To view trace information, you must select the Trace check box on the Registered Handlers page for this event handler and event combination. |


Use the Event Monitor - Handler Exceptions page (EOEN_EVENT_MON3) to view the data, exceptions, and trace information that the selected event handler logged during execution and passed back to the Event Manager framework.
Navigation:
Click the Handlers link for an event instance on the Event Manager - Monitor page.
Click the Display Exceptions button on the Event Monitor - Handlers page.
This example illustrates the fields and controls on the Event Monitor - Handler Exceptions page. You can find definitions for the fields and controls later on this page.
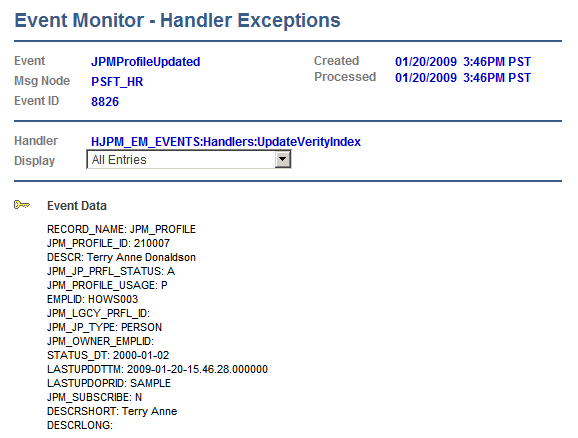
The upper portion of the page displays information about the selected event instance that caused the event handler execution as well as the date and time that the local node began processing the event.
Events raised in a remote database are visible in the Event Monitor component only after the local node receives and processes the asynchronous event message, and only if you have enabled logging for the event when registering the event in the local database through the Event Registry component.
Note: If you inactivate the PeopleTools Integration Broker Service Operation for the generic event message, then the local Event Manager framework does not process any remote events and thus no remote events will be visible in the Event Monitor component.
Field or Control |
Description |
|---|---|
Handler |
The system displays the full path of the application class that implements the event handler. |
Display |
Select a value to filter the type of information that displays on the page. Possible values are All Entries, Exceptions, Event Data, and Trace Entries. The system displays the information that is produced by the event handler in the order in which the event handler produced the information. |
|
The system displays the event instance data. |
|
The system displays information about the event handler exceptions. |
|
The system displays the event handler exception warnings. |
|
The system displays the event handler exception errors. |
|
The system displays event-handler trace information. To view trace information, you must select the Trace check box on the Registered Handlers page for this event handler and event combination. |


