Viewing Benefits Utilization Insights
This topic discusses how the benefits administrators can use the Benefits Insights dashboards to view and analyze benefits utilization data for their workforce.
The Benefits Utilization dashboard is built on the PeopleSoft Insights platform, which relies on an underlying analytics engine and search engine. The benefits data that is visible on the dashboard comes from the Benefits Search indexes.
These videos provide an overview of the PeopleSoft Insights feature:
Video: Insights with PeopleSoft
Video: PeopleSoft HCM Insights
Video: Image Highlights, PeopleSoft HCM Update Image 34: HCM Insights
This topic provides an overview of how to set up the Insights Dashboard for Benefits Utilization analytics and discusses the PeopleSoft Insights Dashboard for Benefits Utilization.
Understanding PeopleSoft Insights
PeopleSoft Insights is an analytical engine that provides visual reports (visualizations) in the form of charts, tables, graphs and so on. The visualizations are based on queries that retrieve data from the PeopleSoft Search Framework.
For information on Insights dashboards, see:
PeopleTools Search Technology: “Monitoring PeopleSoft Search Framework and OpenSearch” and “Working with Insights Dashboards for PeopleSoft Application Data” documentation
This table lists the pages used to view the insights visualization for benefits utilization.
|
Page Name |
Definition Name |
Usage |
|---|---|---|
|
Access the Benefits Utilization dashboard. |
||
|
HC_HBN_PLAN_UTILIZATION_FL |
Review and analyze benefits data. Based on the user privileges, the administrators can access the dashboard. |
Before users can access the benefits utilization dashboards, the following steps should be performed:
Deploy and run the below search indexes.
(PeopleTools > Search Framework > Administration > Deploy Search Objects)
HC_BEN_BENEFIT_EE
HC_BEN_BENEFIT_DEP
HC_BEN_BENEFIT_HST2
Deploy the below dashboards:
Benefits Utilization Tile
Benefits Utilization
(PeopleTools > Search Framework > Administration > Deploy Insights Dashboards)
Assign the user role Benefits Analyst or Benefits Analytics Admin to access and view the dashboard.
()
For more information about the Deploy Insights Dashboards page, see PeopleTools Search Technology: “Working with Insights Dashboards for PeopleSoft Application Data”, Managing a Delivered Dashboard.
Use the Benefits Utilization tile to access the Insights visualizations for benefits data.
Navigation:
This example illustrates the Benefits Utilization tile.
Select the Benefits Utilization tile to access the Benefits Utilization Dashboard.
Use the Benefits Utilization Dashboard (HC_HBN_PLAN_UTILIZATION_FL) to review and analyze the Insights visualizations related to benefits data. Based on the user privileges, the administrators can access the dashboard.
Navigation:
Click the Benefits Utilization Tile.
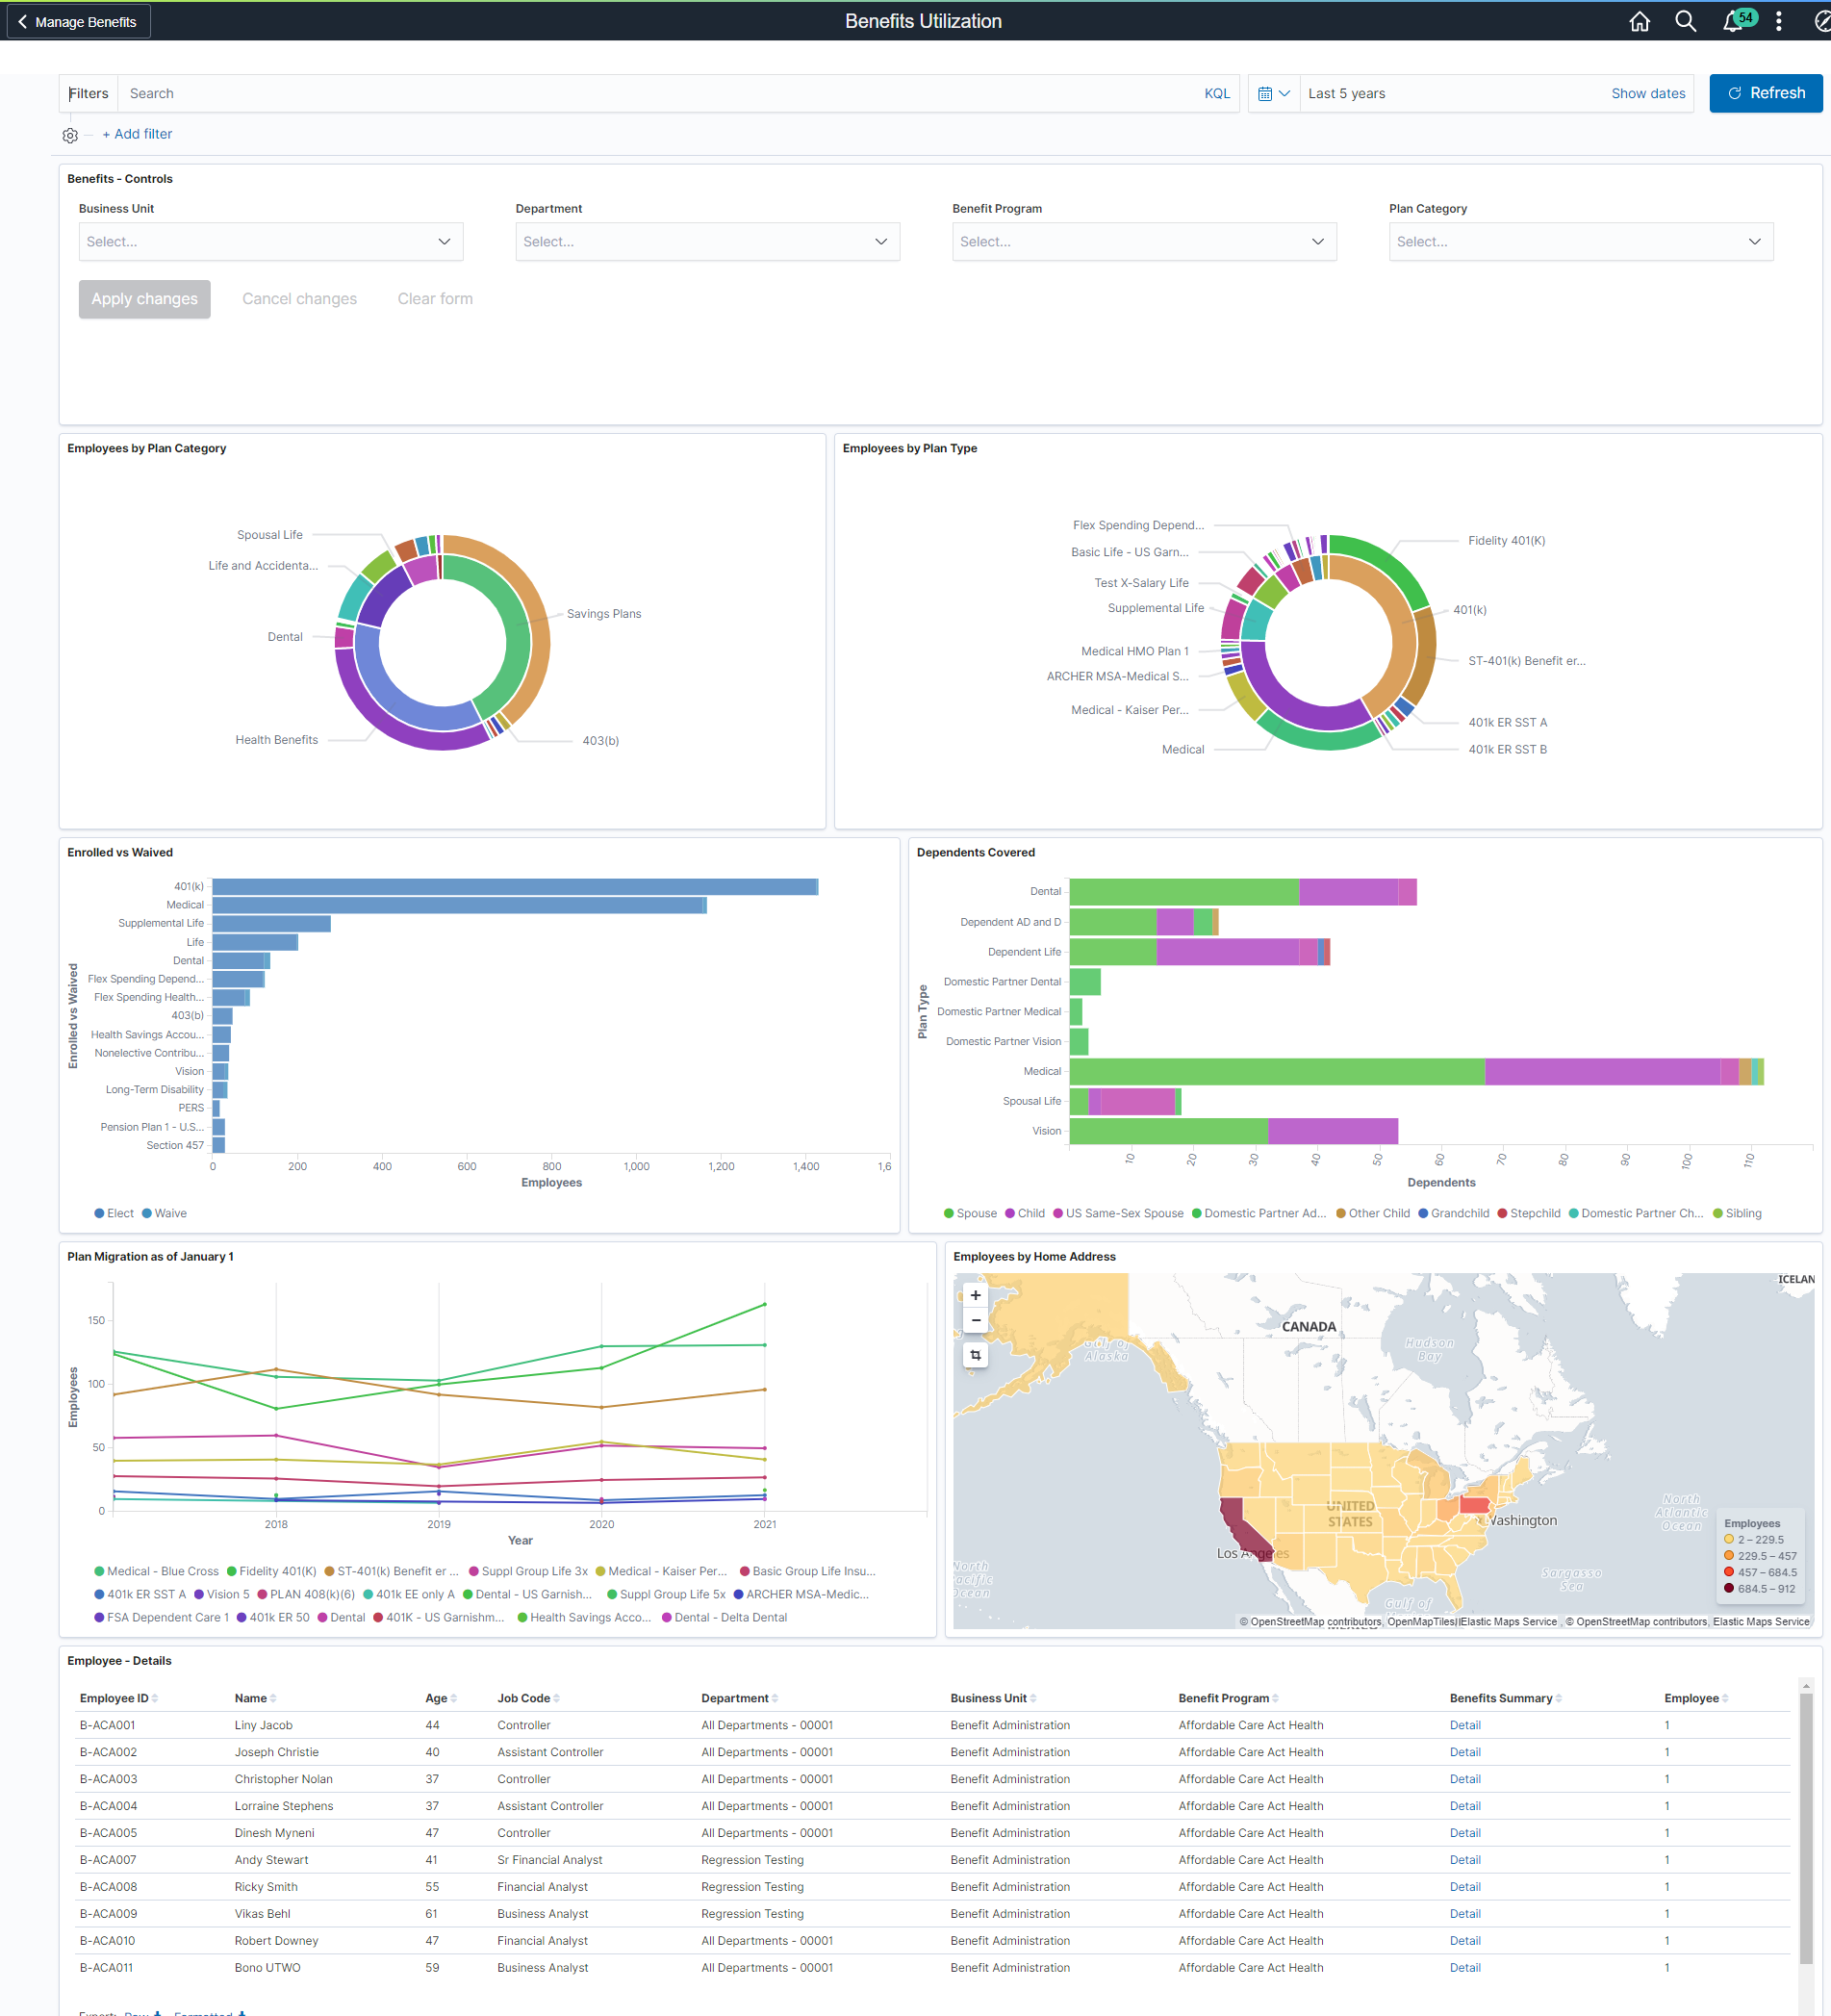
This example illustrates the Benefits Utilization Dashboard.
Warning! PeopleSoft Insights dashboards may not render properly if you access them using unsupported platforms.
The Benefits Utilization dashboard provides you with different visualizations to analyze benefits data. When you select filters or chart items, Insights dynamically updates all visualizations using the sources from the index.
Each visualization enables you to inspect the chart, table or map to view the details of that visualization. Pause over a visualization to have the have additional page elements appear, view numbers, or click items to add filters to your visualizations.
For more information on working with PeopleSoft Insights and filters, see PeopleTools: Search Technology, “Working with Insights Dashboards for PeopleSoft Application Data” documentation.
Benefits – Controls
Additional Filters allow you to filter the analytics based on:
Business Unit
Department
Benefit Program
Plan Category
Delivered Benefits Utilization Visualizations
The Benefits Utilization Dashboard provides this collection of visualizations:
|
Visualization |
Description |
|---|---|
|
Employees by Plan Category |
This visualization shows the benefit plan categories and corresponding plan types based on the employees who opted for it. You can hover over the visualization to see the count and percentage of employees for each benefits plan category and plan type. By default, the inner doughnut shows the top five benefits categories with the highest number of employees. The outer doughnut represents the top ten benefit plan types for each category. You can click on each category or plan type to filter the visualizations. For example, if we click on Savings Plan, the page refreshes, and all the charts are updated to show data based only on the selected category. Note: You can modify the number of items to be displayed in the visualization based on your organization's requirements. |
|
Employee by Plan Type |
This double doughnut visualization shows the count and percentage of employees based on their selected plan type. The inner doughnut represents the benefits plan type. The outer doughnut represents the benefit plans corresponding to the plan type. You can hover over the image and view the count and percentage of employees who opted for a specific plan type, or benefits plan. Click on a plan type or a specific benefits plan to filter the visualizations accordingly. |
|
Enrolled vs Waived |
This visualization shows how many employees are currently enrolled or have currently waived a specific plan. Employees with terminated benefits and employees that have never been enrolled are not included in this count. You can hover over the image and view the count of employees enrolled or waived for a specific plan type. Click on the chart to filter the analytics based on a specific plan type. |
|
Dependents Covered |
This visualization shows the current number and type of dependents enrolled for each plan type. You can hover over the image and view the type and count of dependants for each plan type. Click on the chart to filter the analytics based on a specific plan type or dependant type. |
|
Plan Migration as of January 1 |
This visualization shows how many employees have enrolled for a specific plan each year (as of January 1). By default, the dashboard shows the last five years of data. Note: To create the January 1st data, a derived value is created in the index. The index looks at the enrollment date to determine if the employee had the benefit plan on Jan 1st of that year. If so, a value is placed in the index for that year. The index is based on a rolling five years period. To use a different date than Jan 1st, you can modify the index's derived value calculation. You can hover over the image and view the count of employees for each plan type based on the year. Click on the chart to filter the analytics based on a specific plan type or year. |
|
Benefits – by State |
This visualization shows the geographical distribution of the employees on an interactive map. The State provided in the employee's home address is used to populate the visualization. You can hover over the image and view the number of employees residing in each state. Click on the chart to filter the analytics based on a specific state. |
|
Employee Details |
Based on the applied filter, the Employee Details section lists out all the employees and their details in tabular form. Click see the Detail link against an Employee ID in the Benefits Summary column to open the Benefits Summary page. For more information, see Benefits Summary Page. |