Using the Element Trace Viewer
Use the Element Trace Viewer component to display an element resolution chain that shows how and in what sequence each element was resolved on the process list during absence and payroll processing. It provides a better user experience for reviewing either internal or extracted (customer) element resolution chains. You will need to run the absence and payroll process with the option Trace All Elements ON to be able to display the trace using this component.
|
Page Name |
Definition Name |
Usage |
|---|---|---|
|
GP_AUD_MAIN_FL |
View elements that were resolved for a payee during processing when Global payroll and/or Absences were run with the Trace All Elements option ON. The page allows navigating through the different calendars and segments executed in the calendar group with the Trace flag turned ON. For each calendar/segment, the system displays the list of elements that were resolved, along with their details. |
Use the Element Trace Viewer page (GP_AUD_MAIN_FL) to view elements that were resolved for a payee during absence or payroll processing that was run with the option Trace All Elements ON, using PeopleSoft Fluid User Interface.
Navigation:
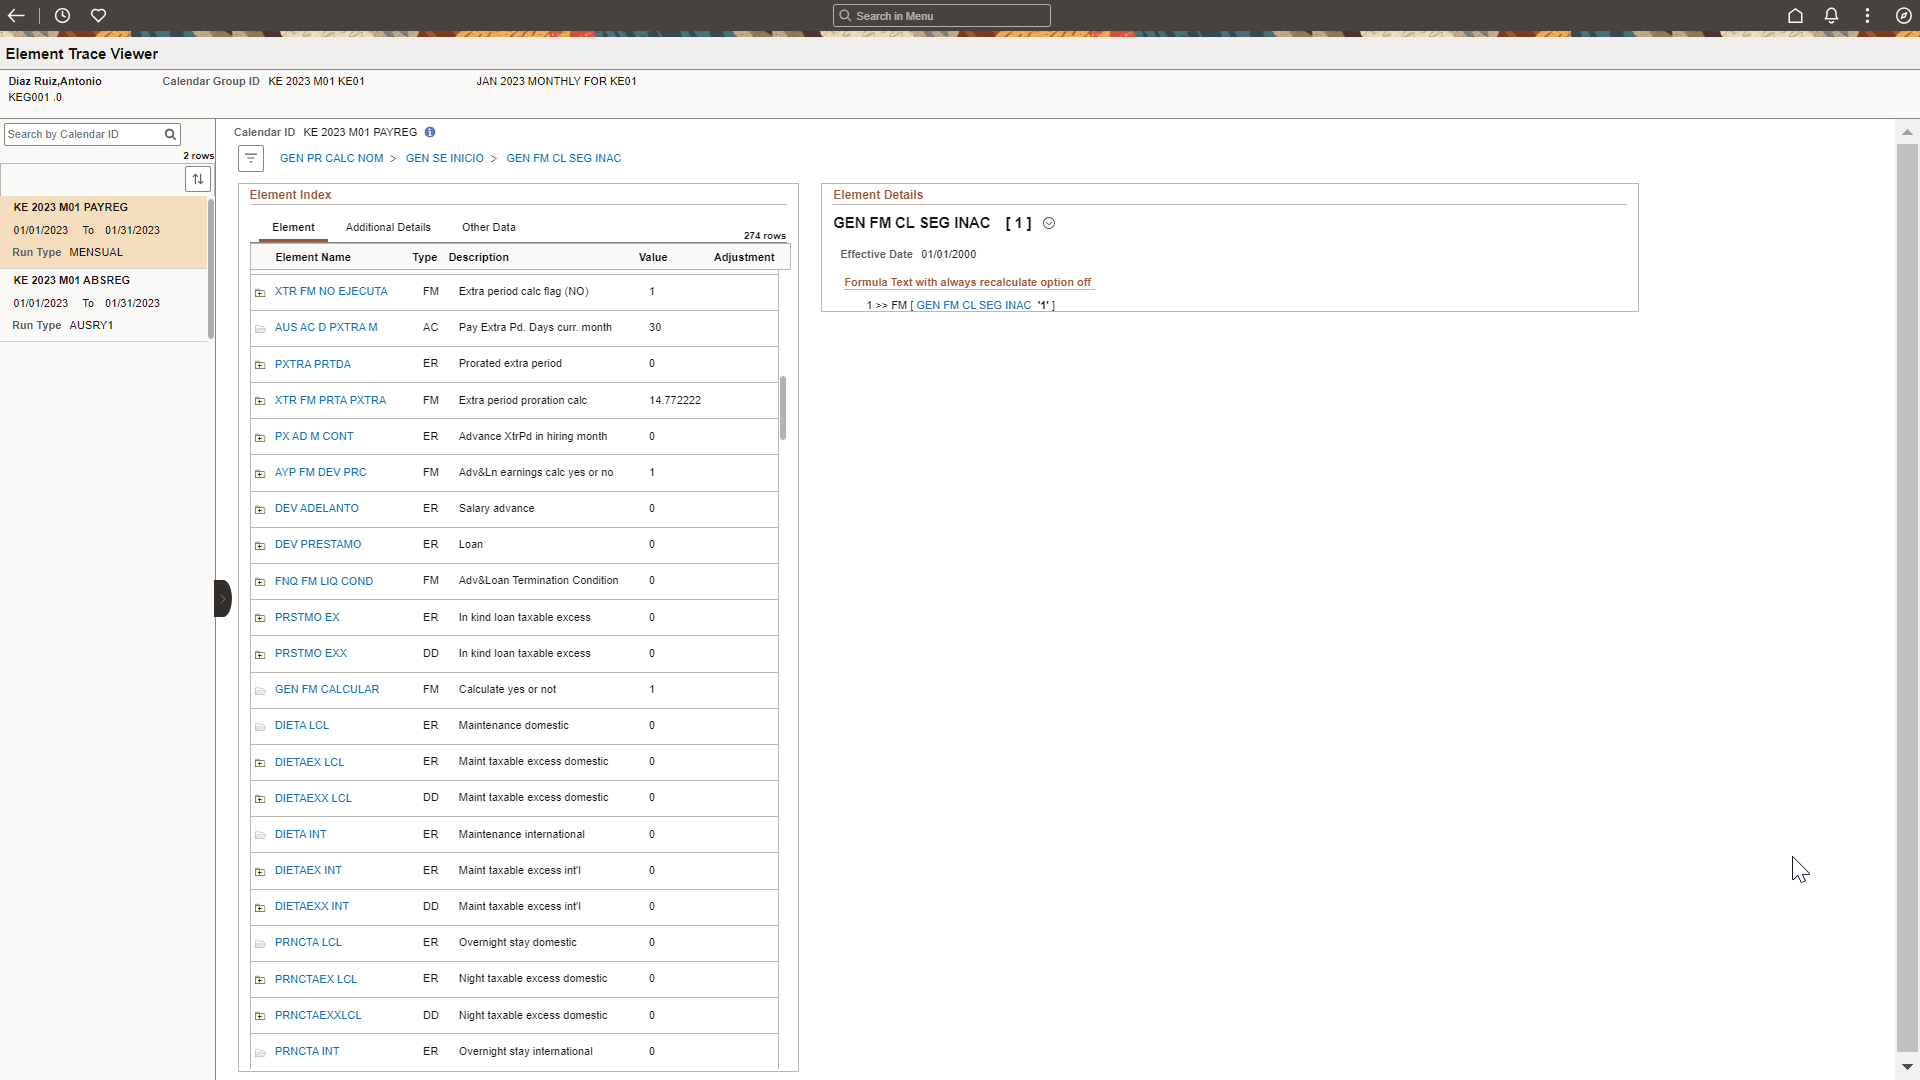
This example illustrates the fields and controls on the Element Trace Viewer page.
Header
This section displays the employee's name, employee ID, employee record and calendar group ID with the description In case of element trace loaded from a file that was created using the Element Trace extraction tool, employee ID will be displayed masked and Employe name will be the concatenation of the Trace ID and the masked Employe ID.
Left Panel
This panel displays the list of calendars or segments that have been traced. Each one will display the Calendar ID, Segment Begin Date, Segment End Date and Run Type. The reversal segments are identified with the letter 'R'.
Click a calendar segment on the left panel to load the corresponding element details in the right panel containing the Element List and Element details columns. You can filter the result list in the left panel by calendar or segment name.
|
Field or Control |
Description |
|---|---|
|
|
Click to show or hide the sections on the left panel. |
|
|
To change the sort order, click the grid sort icon and choose a new sort option. You can sort by Calendar ID, Segment Begin Date or Run Type. Note: Default order is based on the processing order (descending). |
 (Show or hide navigation)
Right Panel
This panel displays the content of the calendar or segment that is selected on the left panel. The main panel consists of two sections: Element Index and Element Details.
|
Field or Control |
Description |
|---|---|
|
|
Click this icon to view the details of the calendar being displayed. |
|
|
Click this icon to search for any element resolved in the selected calendar/segment; regardless to its level, the panel will list all the parent elements where the chosen element(s) were calculated or used. Note: The icon has a different color (light blue) if there’s a filter in place. |
|
Menu Path |
It displays the execution path of the selected element, including the process list and section. It is being updated as the user navigates through the elements. The user can go back and forth in a particular execution, so this path is another way to navigate through the execution. By clicking in the process list name, the index will be refreshed to the default view: list of elements executed from the process list By clicking in the section name, the index will be refreshed to display just the elements executed in that section. |
|
|
Hover the mouse cursor over the Folder icon to view additional element details such as Audit ID, element level and slice. This information is also available in the Other Data tab This icon is only clickable for elements with details, which means they have children elements. Click on the icon to expand the next level, the grid/index will refresh with the details of the calculation of the selected element. |


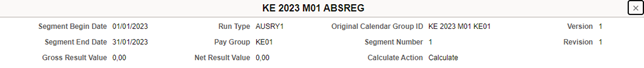
Click  icon to view the details of the calendar/segment being selected.
Calendar or Segment details
Element Index
The Element Index section includes three tabs: Element, Additional Details and Other Data. The Element tab displays the content of GP Audit table (Element Resolution Chain). By default, the elements displayed are the ones listed in the sections of the process list, however the user can drill down to get details of the elements used to resolve the element. The Additional Details tab displays the details of the elements, including the section in which the element was executed, and slice begin and end dates. You can view the Pin Number, Audit ID, Level, Sequence, Order and Time Execution in the Other Data tab.
|
Field or Control |
Description |
|---|---|
|
Element Name |
The grid displays the elements that have been executed in the calendar or segment. When you click on the Element Name, the Element Details section will be refreshed with the details of the calculation. By combining the trace with the element definition, the system provides a more comprehensive view of the execution. |
|
Type |
Type of element. |
|
Description |
Meaningful description of the element. |
|
Value |
Displays the resolved value of the element. |
|
Adjustment |
Displays the retro delta adjustment value that has been forwarded to the element. |
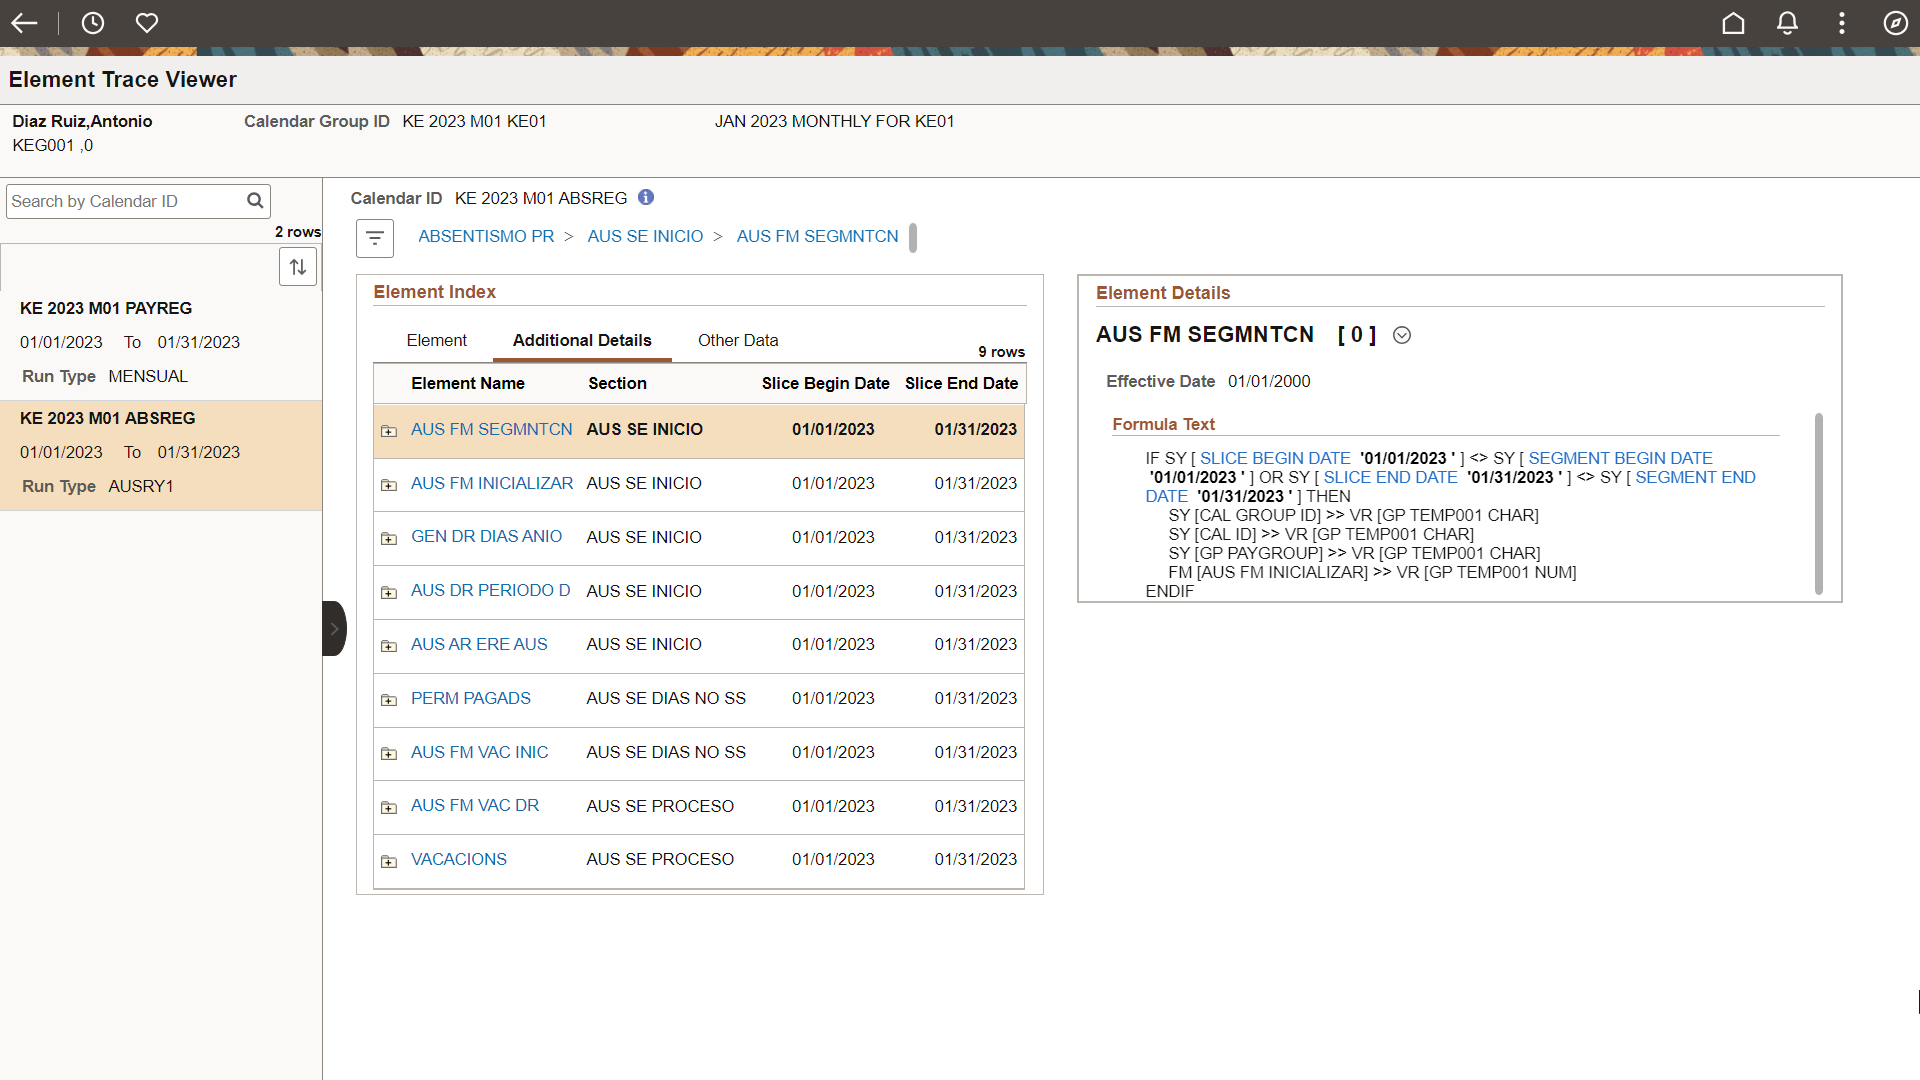
Click the Additional Details tab to view the Element Index - Additional Details page.
This example illustrates the fields and controls on the Element Index - Additional Details page.
|
Field or Control |
Description |
|---|---|
|
Element Name |
Click to access the Detail Audit Chain page where you can view the order in which the element resolved. |
|
Section |
The section in which the element has been executed. |
|
Slice Begin Date and Slice End Date |
Displays the begin and end dates of the slice in which the element was processed. |
Click the Other Data tab to view the Element Index - Other Data page.
This example illustrates the fields and controls on the Element Index – Other Data page.
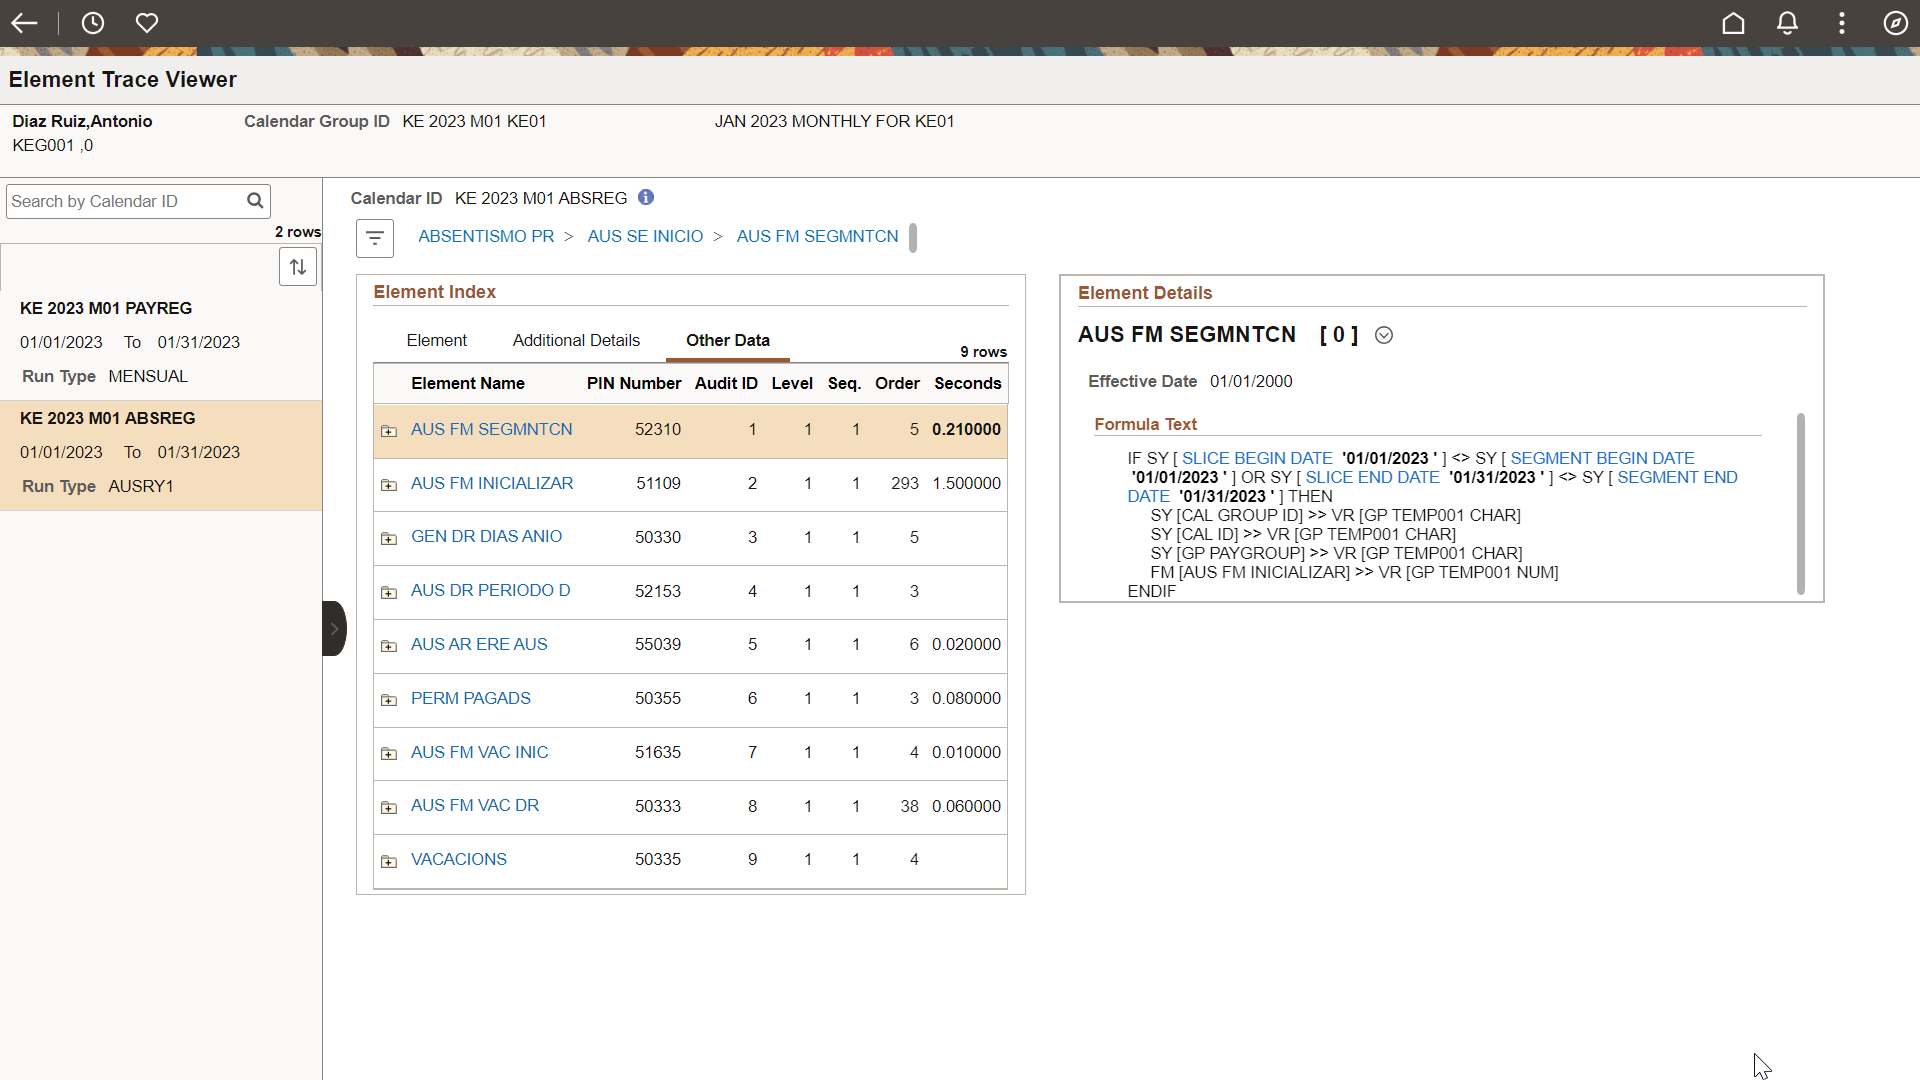
Element Details
The Element Details section displays the value that each element took during the process in addition to the element execution and step-by-step element resolution, based on element type. You can also drill down and navigate to more element resolution details. Note: This section might be located below the element index section, it would depend on your browser zoom in percentage, you can zoom out or collapse the calendar/segment navigation panel to display it side by side.
|
Field or Control |
Description |
|---|---|
|
|
Click this icon to either edit the element or compare it. The Edit link takes you to the corresponding set up page in a new browser tab where you can modify the element definition as needed. This option is available when the Element Resolution Chain has been generated in the environment. The 'Compare' option is available when Element trace is loaded into the environment (target) from a file that was generated in a different environment (source) using the Element Trace Extraction tool. By selecting this option, you will be able to compare the definition of the element between the two environments. |

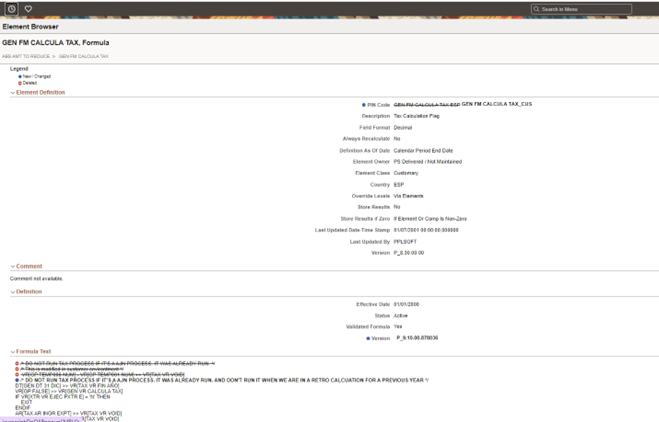
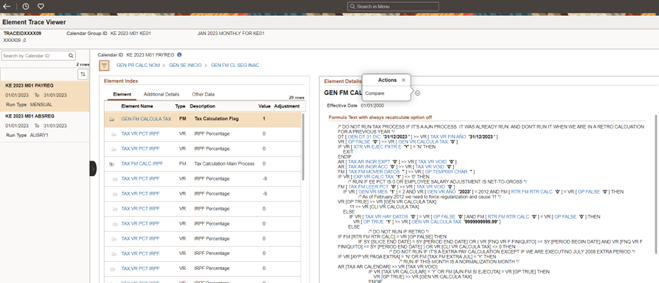
This example illustrates the details of a formula element.
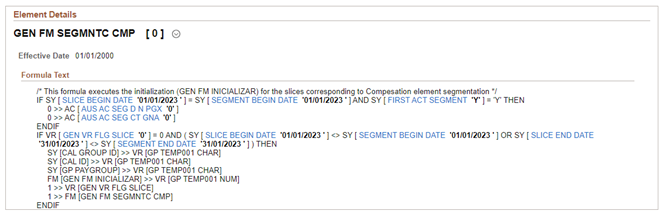
System displays the text of the formula together with the resolved amounts of the used elements, which makes much easier to understand the calculation. By clicking on the formula text, users can also navigate directly to the executed elements.
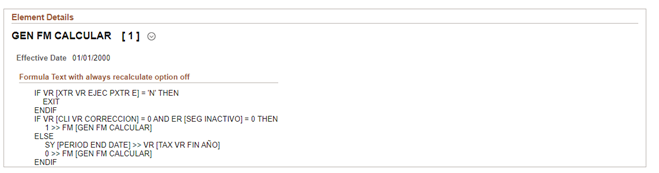
If a user selects an element that has previously been executed and has the option Always recalculate OFF, the system displays the following message: Formula Text with the Always Recalculate option off. There is no possibility to drill down into other elements because the element is not resolved while processing the parent element, the parent element uses its value but the child element is not re-calculated.
This example illustrates the Element Details with Always Recalculate option turned OFF.
This example illustrates details of array execution.
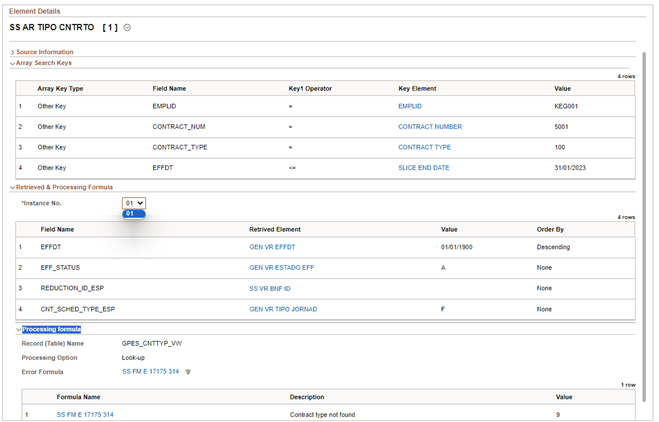
The user can navigate to the various rows returned by the array using field instance number.
Element Trace Loaded from File
Element Trace Viewer can be used to display the information of a Trace that has been loaded using the Element Trace Extraction Tool.
Example of Trace being loaded
In this case system provides the possibility to Compare the setup of the selected element as it come in the file and as it is in the database where the trace has been loaded.
Result of the Compare