Viewing Quick Analytics Headcount Pivot Grids
These topics provide an overview of pivot grids and discuss how to view headcount pivot grids.
|
Page Name |
Definition Name |
Usage |
|---|---|---|
|
PTPG_PGVIEWER |
Analyze the headcount movement within your organization by job actions, such as hires or terminations, over a period of time. |
|
|
PTPG_PGVIEWER |
View the distribution of the organizational population. Administrators can view this information for employees, contingent workers, and persons of interest based upon the current job effective dated rows. Managers can view the distribution of the organizational population by job code based upon the current job effective dated rows. |
|
|
PTPG_USERPROMPTS |
Enter the default values to further refine a query when you run it. |
|
|
PTPG_GRIDVIEWER |
Select filter options and view a number count for those that meet the criteria |
|
|
PTPG_DISPLAYOPT |
Define the display settings for the user results chart. |
|
|
Pivot Grid Drilldown Page |
PTPG_DRILLDN_PG |
View a list of employees that make up the results for the bar or pie piece selected in the chart. |
Pivot Grid functionality provides grid and chart visualization with the ability to filter data by any dimension and drill down on facts to the individual detail level. Pivot grids use PS Queries as the basis to gather data and then transform the results into easy to use pivot tables or charts.
PeopleSoft HCM delivers headcount pivot grids to enable your organization to take a proactive approach to planning, analyzing, and anticipating workforce needs by filtering and presenting data graphically, using different views. Headcount grids enable HR Administrators to view headcount data visually and filter this data to a more granular level. These grids also provide managers with additional insight into the organization, particularly when looking to restructure. Users view the data within the context of the transaction, ensuring proper data security based on their current security access settings used for other reports executed from Workforce Reports.
Video: Pivot Grid Overview
Video: PeopleSoft HCM 9.2 Pivot Grids
PeopleSoft HCM delivers these headcount pivot grids for the following users:
Administrator
Headcount Movement - Shows administrators all job actions that occurred during the specified reporting period (the default chart renders the latest 12 months).
Current Headcount - Enables administrators to compare the distribution of the organizational population by employee, contingent worker, and persons of interest, based upon current job effective dated rows.
Manager
Headcount Movement - Displays job actions of those that report to the logged-in manager that occurred during the specified reporting period.
Current Headcount - Allows managers to compare the distribution of the organizational population by job code based upon current job effective dated rows.
The headcount pivot grids are accessible from the Direct Reports pagelet on the Manager Dashboard (see Viewing the Manager Dashboard Pagelets).
To provide flexibility, you can define prompts to enable the user to display the data they need in the pivot grid.
Filters can be applied to the data to further slice it for analysis. Once the results are rendered, the user is able to drill down to the data details and interact with the data in a table format.
You can use the delivered pivot grids, or quickly configure your own using a 5 step setup wizard based off of any PS Query. For more information on Pivot Grid functionality, see the product documentation for PeopleTools: PeopleSoft Pivot Grid.
Note: Pivot grids require that you use PeopleTools 8.53, or greater.
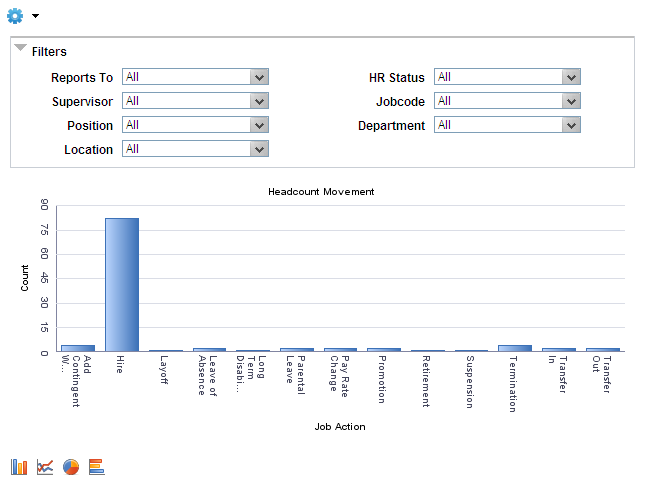
Use the Headcount Movement pivot grid page (PTPG_PGVIEWER) to analyze the headcount movement within your organization.
Navigation:
and then select the Headcount Analytics link, Headcount Movement link at the bottom of the Direct Line Reports pagelet.
This example illustrates the fields and controls on the Headcount Movement page. You can find definitions for the fields and controls later on this page.
Field or Control |
Description |
|---|---|
Filters |
Select values from the following filter drop-down fields to narrow your report results.
All fields are set to All as a default value. The drop-down list contains values you can select or deselect, to enable you to include one or many criteria options for a field. For example, you can choose to view the results of one department, such as Finance, several departments, such a Finance and Human Resources, or select to include all valid departments in the drop-down list. When you select various options, the field will display (Multiple Items). Use the Select All check box in the drop-down list to select or deselect all field values. When you have not selected any items for the field, the filter field will default back to All. The chart will update dynamically after selecting criteria for each filtering field. As you select items within each filtering field, other filter fields may be hidden or shown as display only, based on valid values that are available based on your current filter settings. For example, if you select a specific manager in the Supervisor field, only job codes associated with his employees will be available in the Jobcode field. If all the people reporting to this manager have the same job code, then the page presents the Jobcode field as display only with that one job code as the filter value. To refresh the chart, change the available filter fields to All. This will reset the other fields in the Filter group box. |
The page displays the chart in the middle of the page, based upon the search criteria filter settings. You can change how the chart appears by selecting from one of these icons at the bottom of the page:
Bar Chart
Line Chart
Pie Chart
Horizontal Bar Chart
Pause over individual graphic items, such as a bar or pie, to view the job action details and count. Select the bar or pie piece to select from the following options:
Detailed View:
Select this option to access the Pivot Grid Drilldown page to view a list of employees that make up the results for the bar or pie piece.
Drilldown To:
Administrators can select this option to analyze report data by categories, such as:
Full/Part time status
Age group
Paygroup
Gender
Marital status
Regulatory region
Salary administration plan
Establishment
Managers can select this option to analyze report data by categories, such as:
Full/Part time status
Salary administration plan
Regulatory region
Establishment
You can perform drill-downs within a drill-down. When you do this, the page displays a set of breadcrumbs above the graphic to show the drill-down path you have taken.
For example, you can drill-down to view those people with a job action of Hire by age and then drill down again to view the gender of the people in the 35-44 age category. In the example shown here, the first bread crumb is Job Action (Hire), then Age Group (35-44), and the current graphic shows the Gender categories within the previously selected hires between the ages of 35 and 44:
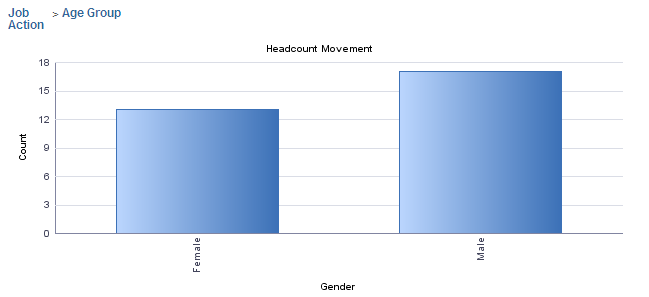
Select any bread crumb to return to that view of the chart.
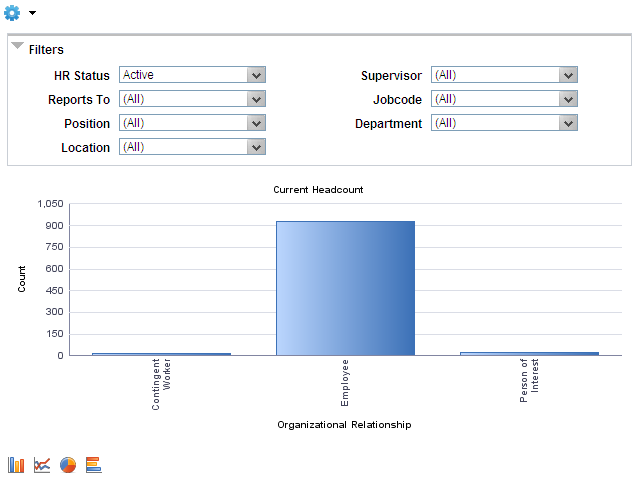
Use the Current Headcount pivot grid page (PTPG_PGVIEWER) to view the distribution of the organizational population.
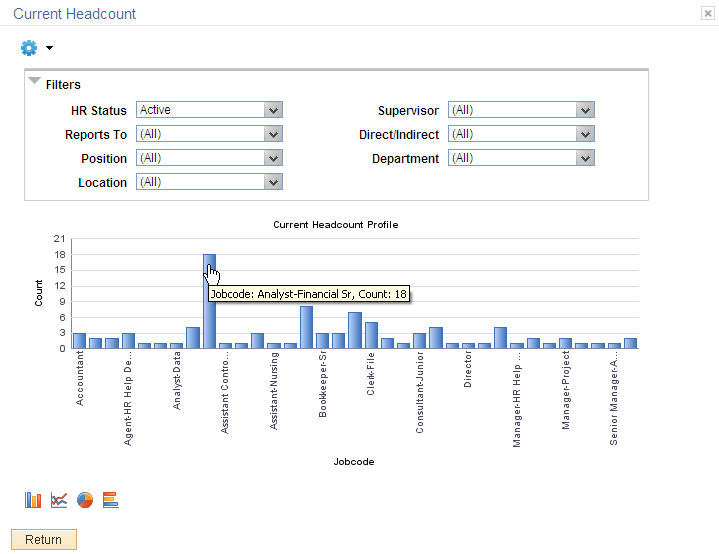
Administrators can view this information for employees, contingent workers, and persons of interest based upon the current job effective dated rows. Managers can view the distribution of the organizational population by job code based upon the current job effective dated rows.
Navigation:
and then select the Headcount Analytics link, Current Headcount link at the bottom of the Direct Line Reports pagelet.
This example illustrates the fields and controls on the Current Headcount page for the administrator. You can find definitions for the fields and controls later on this page.
This example illustrates the fields and controls on the Current Headcount page for the manager. You can find definitions for the fields and controls later on this page.
Field or Control |
Description |
|---|---|
Filters |
Select values from the following filter drop-down fields to narrow your report results.
All fields are set to (All) as a default value (with the exception of the HR Status field for the administrator view, which defaults to Active). The drop-down list contains values you can select or deselect, to enable you to include one or many criteria options for a field. For example, you can choose to view the results of one department, such as Finance, several departments, such a Finance and Human Resources, or select to include all valid departments in the drop-down list. When you select various options, the field will display (Multiple Items). Use the (Select All) check box in the drop-down list to select or deselect all field values. When you have not selected any items for the field, the filter field will default back to (All). The chart will update dynamically after selecting criteria for each filtering field. As you select items within each filtering field, other filter fields may be hidden or shown as display only, based on valid values that are available based on your current filter settings. For example, if you select a specific manager in the Supervisor field, only locations associated with the manager’s employees will be available in the Location field. If all the people reporting to this manager have the same location, then the page presents the Location field as display only with that one location as the filter value. To refresh the chart, change the available filter fields to All. This will reset the other fields in the Filters group box. |
The page displays the chart in the middle of the page, based upon the search criteria filter settings. You can change how the chart appears by selecting from one of these icons at the bottom of the page:
Bar Chart
Line Chart
Pie Chart
Horizontal Bar Chart
Pause over each graphic items, such as a bar or pie, to view the organizational relationship (administrator) or job code (manager) details and count. Select the bar or pie piece to choose from the following options:
Detailed View:
Select this option to access the Pivot Grid Drilldown page to view a list of employees that make up the results for the bar or pie piece.
Drilldown To:
Administrators can select this option to analyze report data by categories, such as:
Business unit
Full/Part time status
Age group
Paygroup
Gender
Marital status
Regulatory region
Salary administration plan
Establishment
Managers can select this option to analyze report data by categories, such as:
Full/Part time status
Organizational relationship
Salary administration plan
Regulatory region
Establishment
You can perform drill-downs within a drill-down. When you do this, the page displays a set of breadcrumbs above the graphic to show the drill-down path you have taken. Select any bread crumb to return to that view of the chart.
Use the Prompts page (PTPG_USERPROMPTS) to enter the default values to further refine a query when you run it.
Navigation:
Select the Prompts option from the Options Menu drop-down arrow above the Filters group box on the Headcount Movement or Current Headcount page.
This example illustrates the fields and controls on the Prompts page for the administrator view of the Headcount Movement pivot grid.
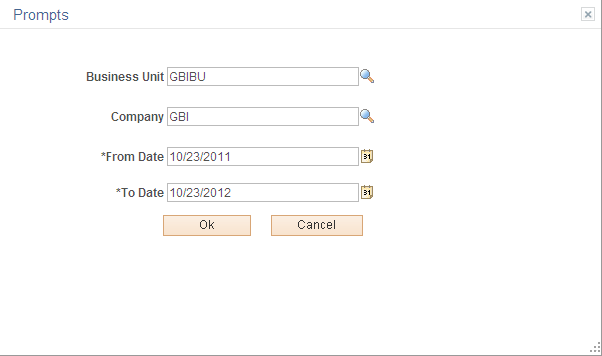
The pivot grids will rendered data for values defined on the Prompts page. The initial values come from the primary permission list assigned to the user. You can change the prompt values during a session of viewing a pivot grid, but they default values will reset to those values associated with the primary permission list for the user after exiting a pivot grid.
The Prompts page and its corresponding fields are available for the following headcount pivot grids:
Current Headcount (administrator view)
Business Unit
Company
Headcount Movement (administrator view)
Business Unit
Company
From Date
To Date
Headcount Movement (manager view)
From Date
To Date
Note: The from and to dates default to the last 12 months.
Use the Pivot Grid Data page (PTPG_GRIDVIEWER) to select filter options and view a number count for those that meet the criteria in a grid format.
Navigation:
Select the View Grid option from the Options Menu drop-down arrow above the Filters group box on the Headcount Movement or Current Headcount page.
This example illustrates the fields and controls on the Pivot Grid Data page.
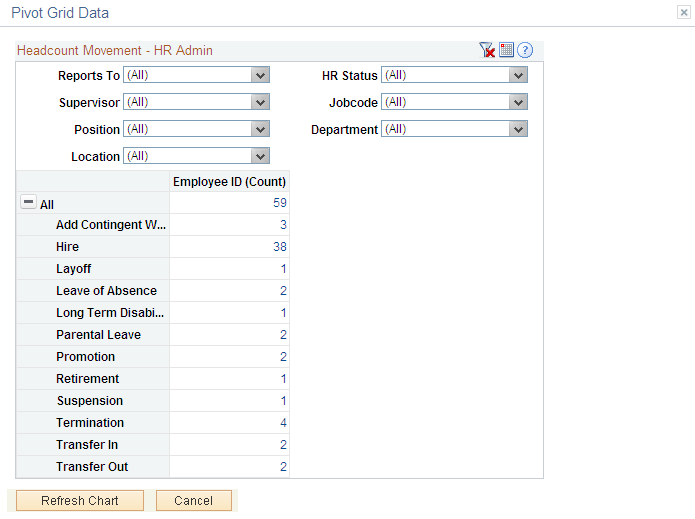
Use this page to view the pivot grid data as a list in a modal window. Use the filters the same as you would on the Current Headcount Pivot Grid or Headcount Movement Pivot Grid.
Select the count number link to access the Pivot Grid Drilldown page and view details about the count you selected.
Select the Refresh Chart button to return to the graphical view of the information reflecting the filters you set on the Pivot Grid Data page.
Use the User Charting Options page (PTPG_DISPLAYOPT) to define the display settings for the user results chart.
Navigation:
Select the Chart Options item from the Options Menu drop-down arrow above the Filters group box on the Headcount Movement or Current Headcount page.
This example illustrates the fields and controls on the User Charting Options page.
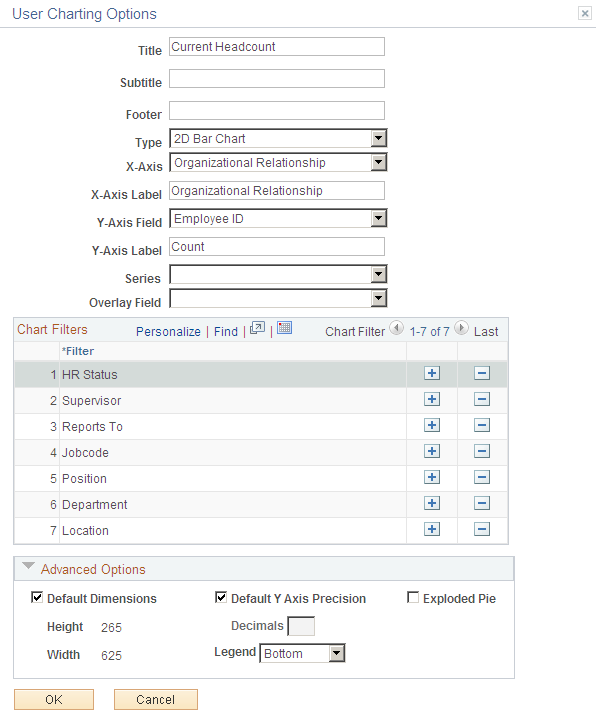
Use this page to change the chart title, chart type, data to be displayed on the x axis, data to be displayed on the y axis, or add or delete chart filters. Changes you make here are good for the current session of viewing the pivot grid.
For example, if you want to view a headcount profile by full time/part time status, select Full/Part Time from the X Axis drop-down list and click OK. The chart will refresh and display the full/part time label and data on the X axis.
Chart Filters
Select the add a row icon button to include additional filters. Filter options vary according to the pivot grid and administrator or manager access.
Select the delete row icon button to remove filter options for this session.
Advanced Options
Field or Control |
Description |
|---|---|
Default Dimensions |
Select this check box to have the system default the 265 height and 625 width for the bar or pie graphic. Deselect this check box to enter your own height and width. |
Default Y Axis Precision and Decimals |
Select to have the system default the decimal precision of 0. Deselect this check box to enter your own decimal precision number in the Decimals field. |
Legend |
Identify where the legend of the chart should appear. Valid values are:
|
Exploded Pie |
Select this check box to detach the pieces of a pie graphic. |