Generating and Viewing Fluid Payroll WorkCenter Pivot Grids
This topic provides an overview of Fluid Payroll WorkCenter pivot grids, and discusses how to generate and view the pivot grids.
See Performing Actions on the Pivot Grid View on the Fluid Mode topic in PeopleTools: Pivot Grid product documentation.
Run control pages enable users to generate Payroll WorkCenter pivot grids based on the type of information available to view (paychecks data, earnings data, deductions data, or paycheck options data). Different fields may be available depending on the link (run control page title) that you click to access the page.
|
Page Title |
Definition Name |
Usage |
|---|---|---|
|
PY_EE_CHK_PG |
Generate the Comparative Checks Pivot Grid where you can view historical paycheck information. |
|
|
PY_DED_PG |
Generate the Comparative Deductions Page where you can view historical deductions information. |
|
|
PY_EARNS_PG |
Generate the Comparative Earnings Pivot Grid where you can view historical earnings information. |
|
|
PY_DED_PG |
Generate the Deductions By Company Pivot Grid where you can view information deductions information by company. |
|
|
PY_DED_PG |
Generate the Deductions By Deduction Code Page where you can view deductions information by deduction code. |
|
|
PY_EARNS_PG |
Generate the Earnings By Company Pivot Grid where you can view information earnings information by company. |
|
|
PY_EARNS_PG |
Generate the Earnings By Earnings Code Pivot Grid where you can view earnings information by earnings code. |
|
|
PY_EE_CHK_PG |
Generate the Employee Paycheck Information Pivot Grid where you can view current paycheck information by company. |
|
|
PY_PAY_OPT_PG |
Generate the Payment Information Pivot Grid where you can view payment distribution information. |
|
|
(Any pivot grid) |
PTPG_PGVIEWER |
View the pivot grid that is generated from the parameters that you entered on the run control page. See PeopleTools: Pivot Grid, Pivot Grid Viewer Overview |
|
Pivot Grid Data |
PTPG_GRIDVIEWER |
View or change the data that is plotted on the pivot grid from which you clicked the Options Menu and then selected View Grid. See PeopleTools: Pivot Grid, Pivot Grid Pagelet Overview |
|
User Charting Options |
PTPG_DISPLAYOPT |
View or change the title, axes, filters, and size of the pivot grid from which you clicked the Options Menu and then selected Chart Options. Note: Some items cannot be changed on some pivot grids. See PeopleTools: Pivot Grid, Examples: Viewing a Pivot Grid Model Using Pivot Grid Viewer |
|
Pivot Grid Drilldown |
PTPG_DRILLDN_PG |
View a table of the detailed data represented by the specific bar, line, or pie-wedge on which you clicked and then selected Detailed View. See PeopleTools: Pivot Grid, Pivot Grid Viewer Overview |
PeopleSoft pivot grid functionality is a PeopleTools technology that provides operational dashboard reporting in the form of a grid, chart, or both. Pivot grids enable users to visually display real-time data and organize it by performing operations such as pivoting and filtering.
Consider watching the following Video Feature Overviews (VFOs) in Oracle’s YouTube.
Video: Pivot Grid Overview
Video: PeopleSoft HCM 9.2 Pivot Grids
For more information on the setup and capabilities of PeopleSoft pivot grids, see PeopleTools: Pivot Grid.
Payroll for North America leverages pivot grid functionality to provide Payroll WorkCenter pivot grids. Fluid Payroll WorkCenter pivot grids provide visual presentation of payroll data that is generated from queries. Using pivot grids, payroll system administrators and managers can filter and view payroll analytics in interactive charts or graphs at a summary level and drill in for more detail to assist in business decisions and analysis.
Payroll WorkCenter pivot grids are role-based and display only the data to which the user ID has security access.
Delivered Payroll WorkCenter Pivot Grids
Using PeopleSoft Query as the data source and PeopleSoft pivot grid functionality, the Fluid Payroll WorkCenter default configuration provides the following pivot grids:
Paycheck Information
Comparative Checks (historical paycheck Information)
Earnings By Company
Earnings By Earnings Code
Comparative Earnings (historical earnings information)
Deductions By Company
Deductions By Deduction Code
Comparative Deductions (historical deductions information)
Payment Options (paycheck and advice options)
Pivot Grid Run Control Pages
Payroll system administrators and managers use query-based run control pages to generate Payroll WorkCenter pivot grids. Links to the delivered run control pages are in the Payroll Analytics folder on the Reports/Processes pagelet, on the Reports tab. When users click a link in the Payroll Analytics folder, the corresponding pivot grid run control page appears. User must enter data on the run control page and click Run to generate the pivot grid.
Pivot grid run control pages are based on data type, with one object definition for each type:
Pay data (PY_EE_CHK_PG)
Earnings data (PY_EARNS_PG)
Deductions data (PY_DED_PG)
Payment options data (PY_PAY_OPT_PG)
Queries, filter values, and drilldown views may be different for specific data within a data type, producing different pivot grids. The pivot grid run control page title indicates the pivot grid that will be generated. For example, the Paycheck Information and Comparative Checks run controls pages are pay data related and therefore have the same object definition (PY_EE_CHK_PG). However, the filter values and drilldown views for paycheck information is different from those for comparative checks information. Different pivot grids will be generated, so the page titles are different. In addition, the Date Type field does not appear on the Comparative Checks pivot grid run control page; the system uses the Check Date field by default.
The Start Date and End Date (or Check Start Date and Check End Date fields) are required-entry fields on all Payroll WorkCenter pivot grid run control pages. The dates that you enter must not be more than one year (365 days) apart.
These page controls appear on all Fluid Payroll WorkCenter pivot grids:
Field or Control |
Description |
|---|---|
|
Click to open the Options Menu, then select from these menu items:
|
Rows |
Displays the filters (maximum of 2) for the model that are used as its X-axis and series. If two filters are selected, the first one becomes the X-axis and the second one becomes the series (legend). |
Columns |
Displays all the facts for the model that you can select as its Y-axis. Click a fact to make it the model’s Y-axis. |
|
Click any of these chart type options to change the rendering and view the data a different way. Available chart types include:
The (vertical) bar chart is often, but not always, the default Payroll WorkCenter pivot grid rendering. |
|
Click to show or hide the filters on the left panel. When a pivot grid model is loaded initially, filters are hidden by default. |
Filters or Facets |
They are displayed on the left panel if shown, as selected in the Update Filters option. Users can use the available filters to change the data to be displayed in the pivot grid model. |
|
Click to drag the corresponding filter to the Columns or Rows region above the model and change how the model is presented. A filter cannot be dragged if the Drag icon appears inactive (in lighter gray color). If a filter is active, orange dotted lines appear as the borders of the filter box when you drag it. |


Note: See the Viewing Pivot Grid Models in Fluid Mode topic in PeopleTools: Pivot Grid product documentation for additional examples on the use of pivot grid controls
Use the Comparative Checks page (PY_EE_CHK_PG) to generate the Comparative Checks pivot grid where you can view historical paycheck information.
Navigation:
Select the Reports tab. Click the Comparative Checks link in the Payroll Analytics folder on the Reports/Processes pagelet.
This example illustrates the Comparative Checks Page.
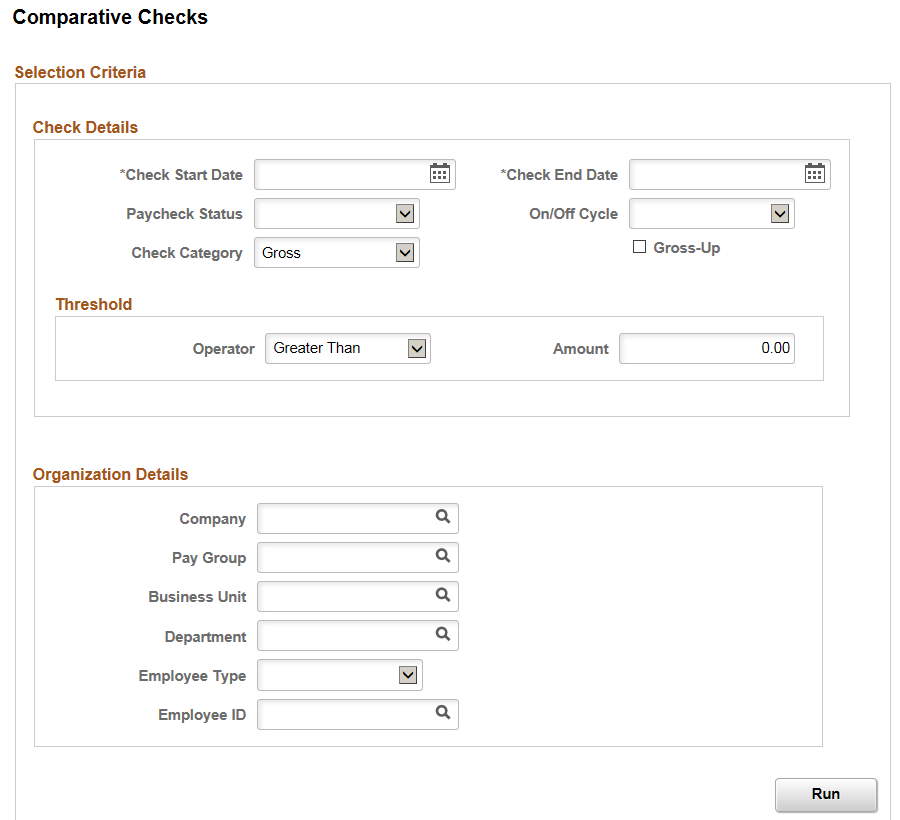
Enter criteria for the comparative checks query to use, then click Run to generate the pivot grid based on that criteria. With criteria entered, the query includes calculated and confirmed checks. If the criteria is left blank, the system searches for all types of paychecks.
The Comparative Checks pivot grid enables you to view historical paycheck information.
This example illustrates the Comparative Checks Pivot Grid .
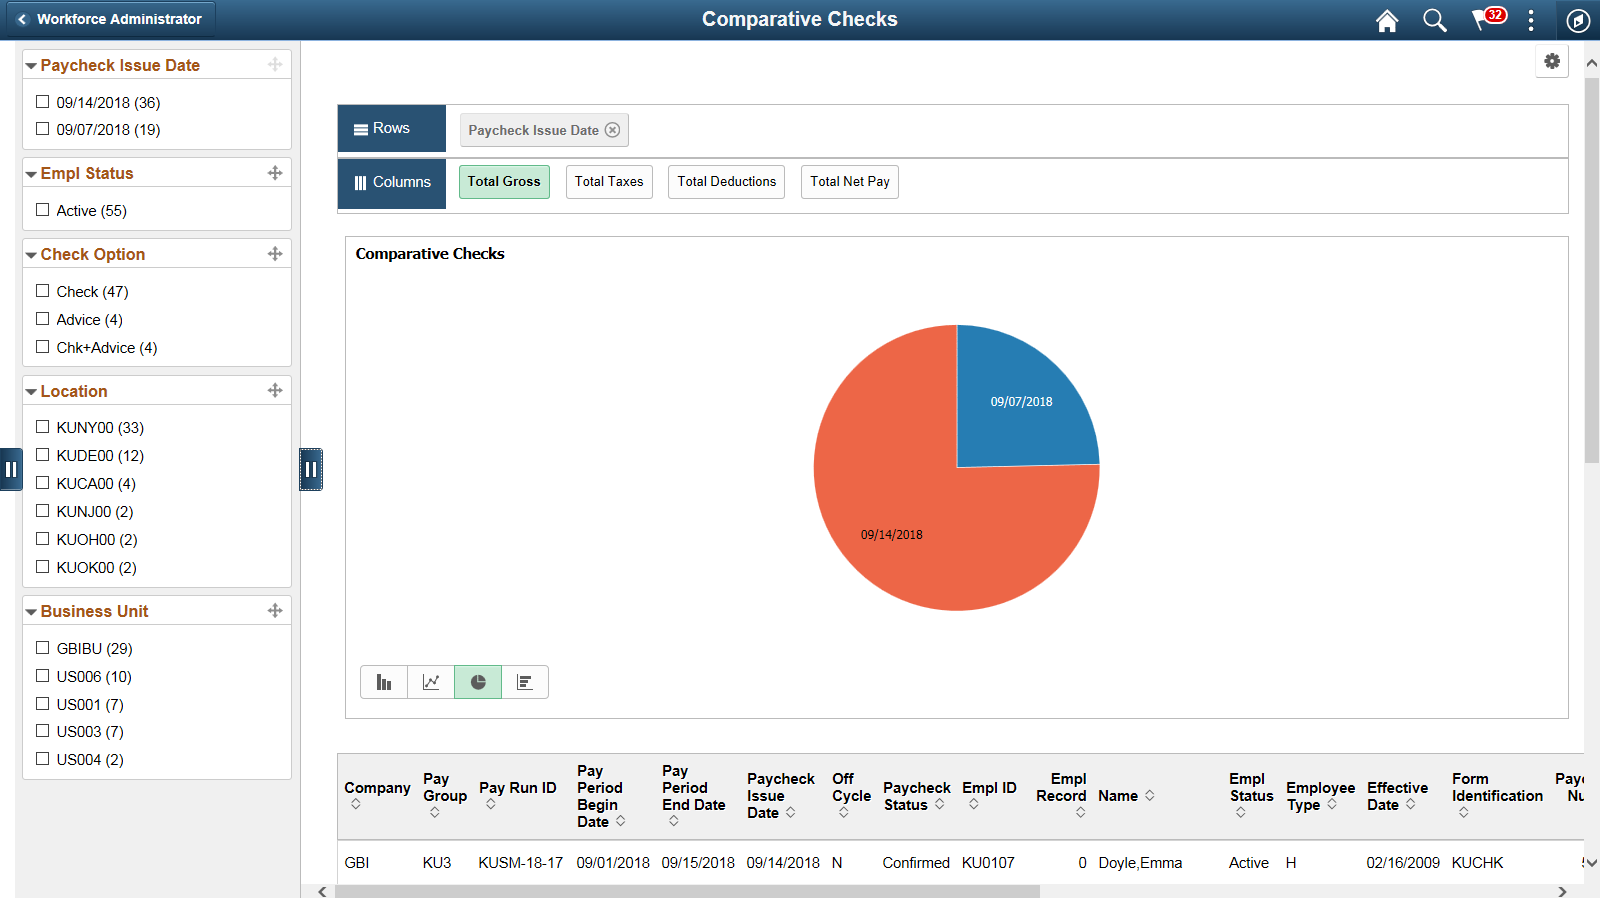
Note: The default rendering is a vertical bar chart. The example shown here uses the pie chart option.
Use the Comparative Deductions page (PY_DED_PG) to generate the Comparative Deductions pivot grid where you can view historical deductions information.
Navigation:
Select the Reports tab. Click the Comparative Deductions link in the Payroll Analytics folder on the Reports/Processes pagelet.
This example illustrates the Comparative Deductions Page.
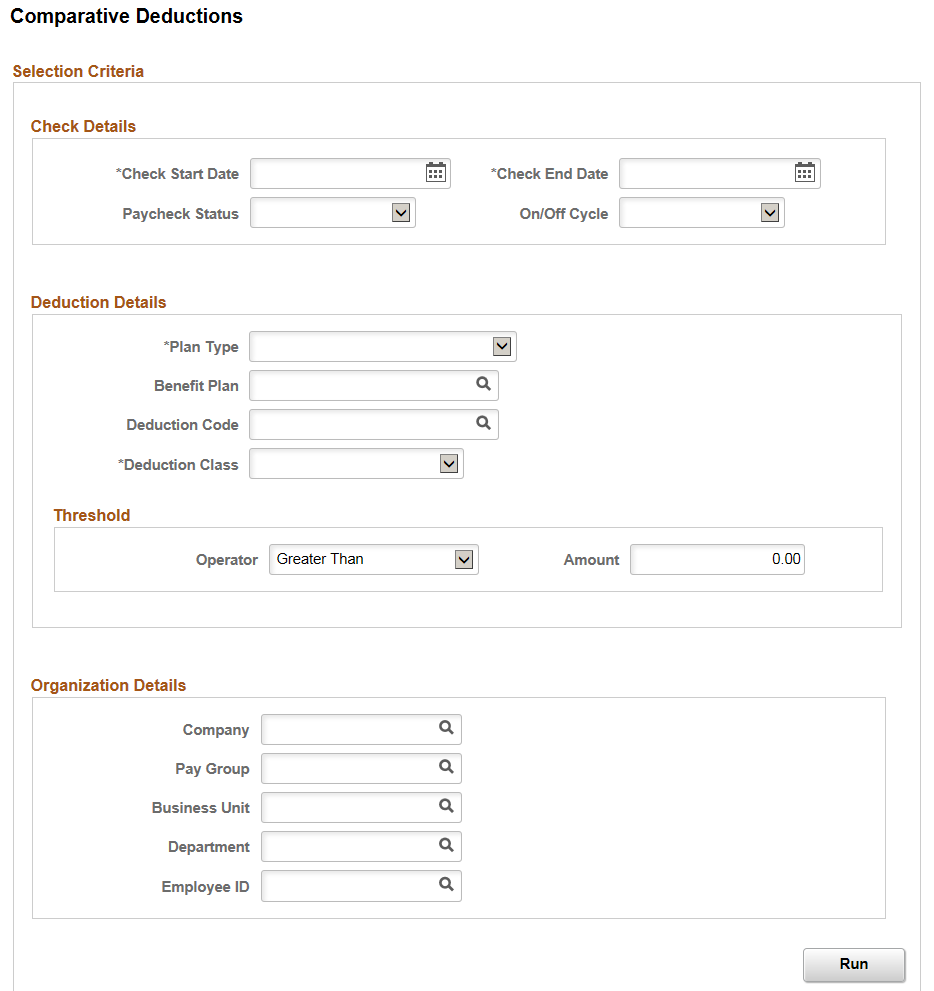
Enter criteria for the comparative deductions query to use, then click Run to generate the pivot grid based on that criteria.
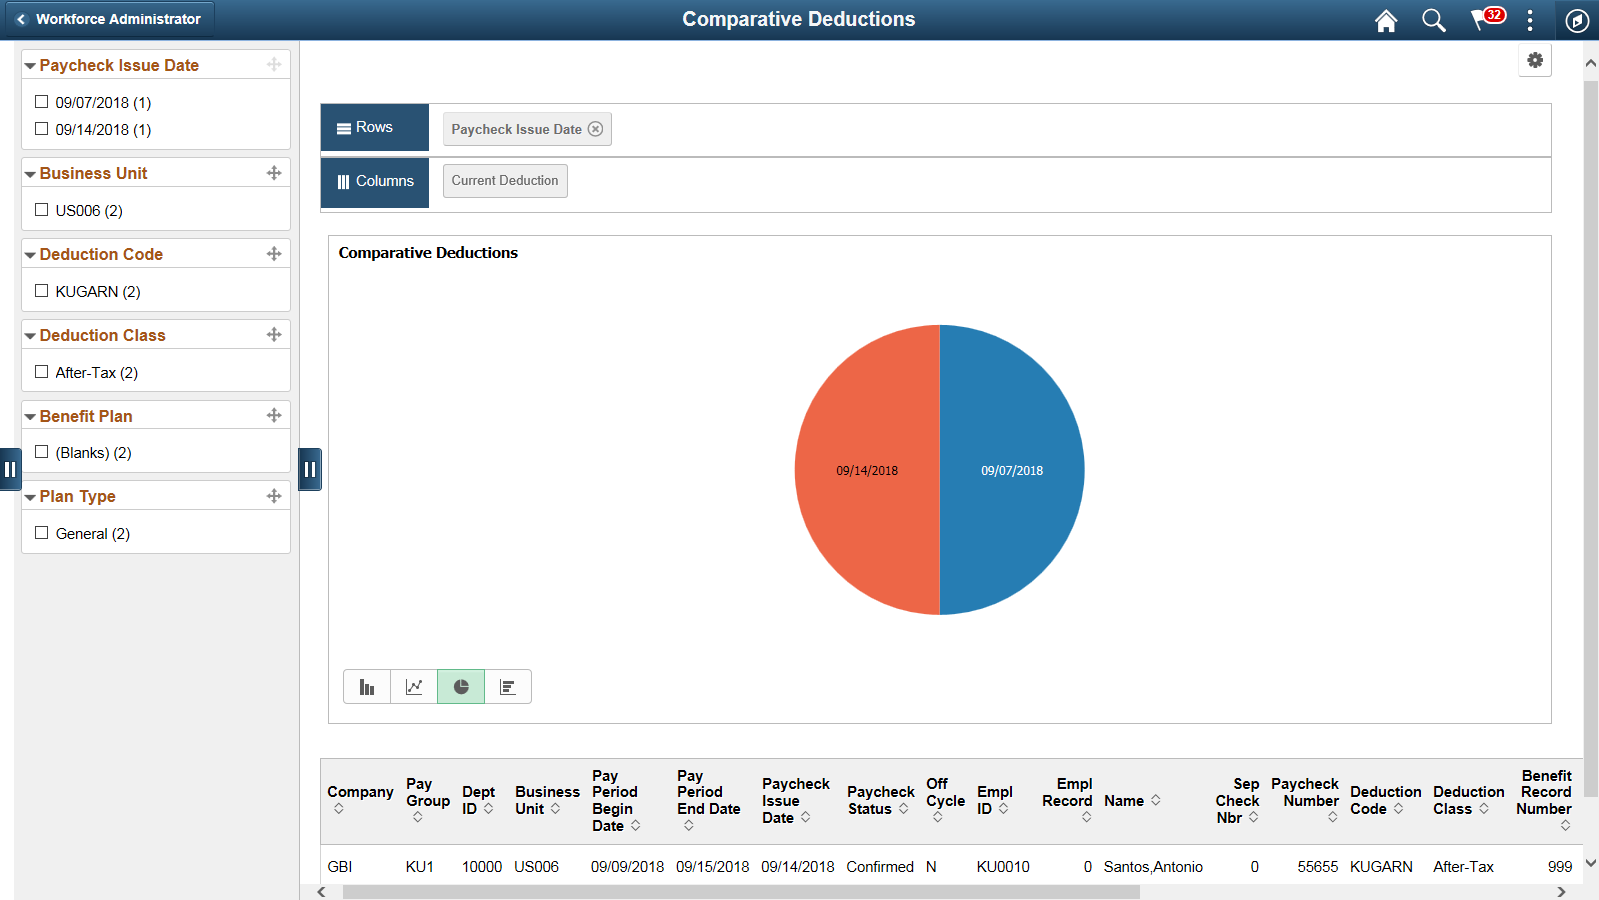
The Comparative Deductions pivot grid enables you to view historical deductions information.
Navigation:
Select the Reports tab. Click the Comparative Deductions link in the Payroll Analytics folder on the Reports/Processes pagelet. Enter parameters on the Comparative Deductions run control page (PY_DED_PG), and click Run.
This example illustrates the Comparative Deductions Pivot Grid.
Use the Comparative Earnings page (PY_EARNS_PG) to generate the Comparative Earnings pivot grid where you can view historical earnings information.
Navigation:
Select the Reports tab. Click the Comparative Earnings link in the Payroll Analytics folder on the Reports/Processes pagelet.
This example illustrates the Comparative Earnings Page.
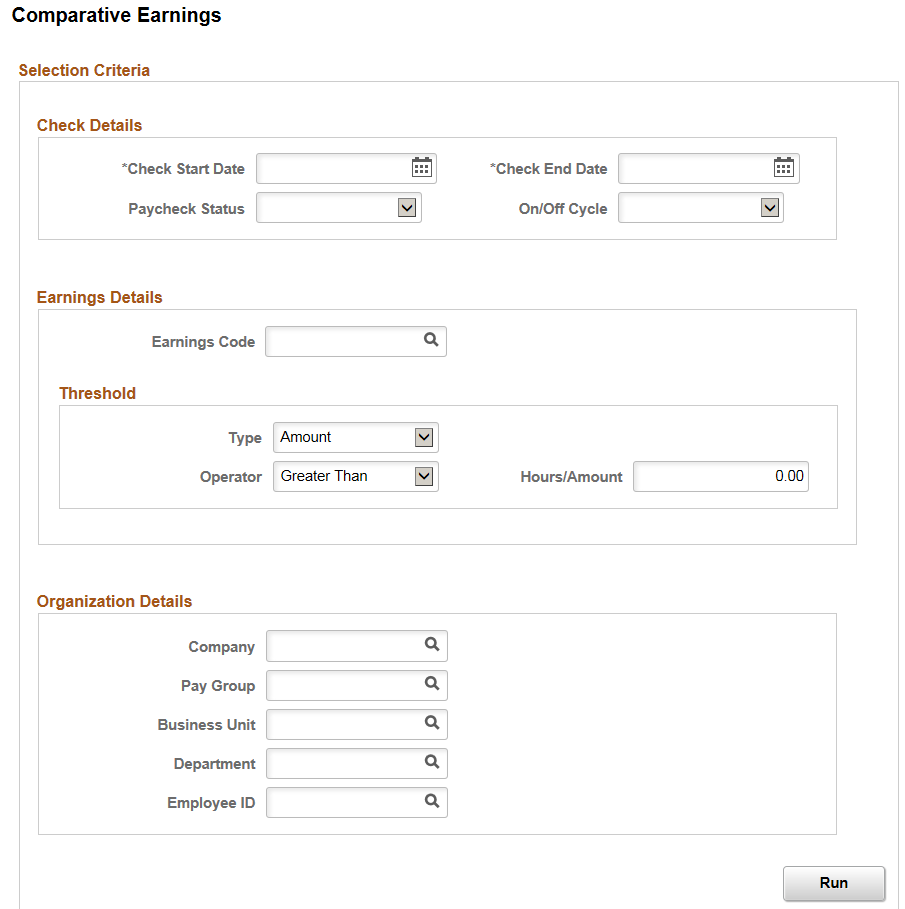
Enter criteria for the comparative earnings query to use, then click Run to generate the pivot grid based on that criteria. Comparative earnings information includes confirmed and unconfirmed earnings.
The Comparative Earnings pivot grid enables you to view historical earnings information.
This example illustrates the Comparative Earnings Pivot Grid.
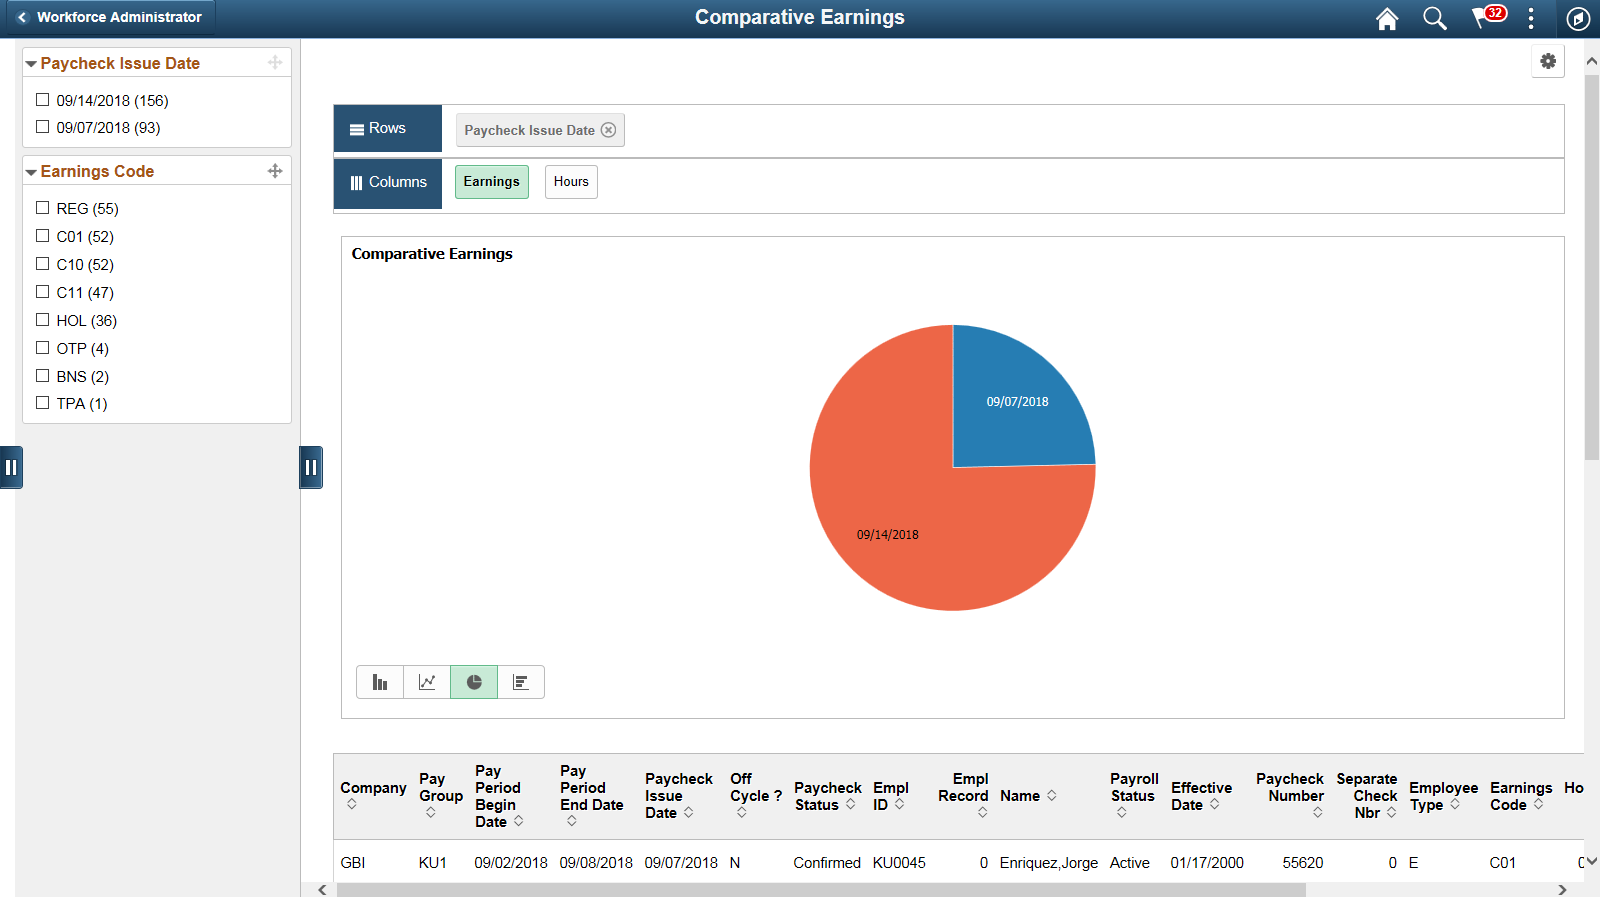
Note: The default rendering is a vertical bar chart. The example shown here uses the pie chart option.
Note: You cannot change the axes on the Comparative Earnings pivot grid.
Use the Deductions By Company page (PY_DED_PG) to generate the Deductions By Company pivot grid where you can view information deductions information by company.
Navigation:
Select the Reports tab. Click the Deductions By Company link in the Payroll Analytics folder on the Reports/Processes pagelet.
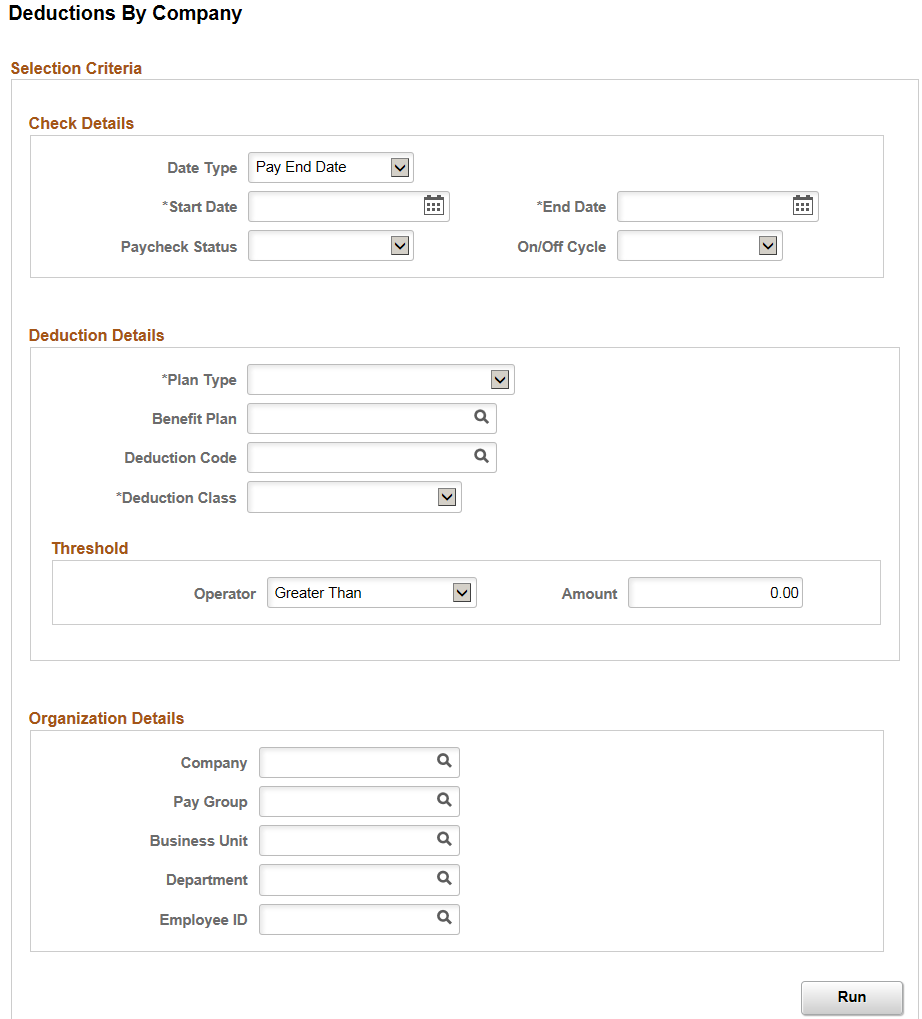
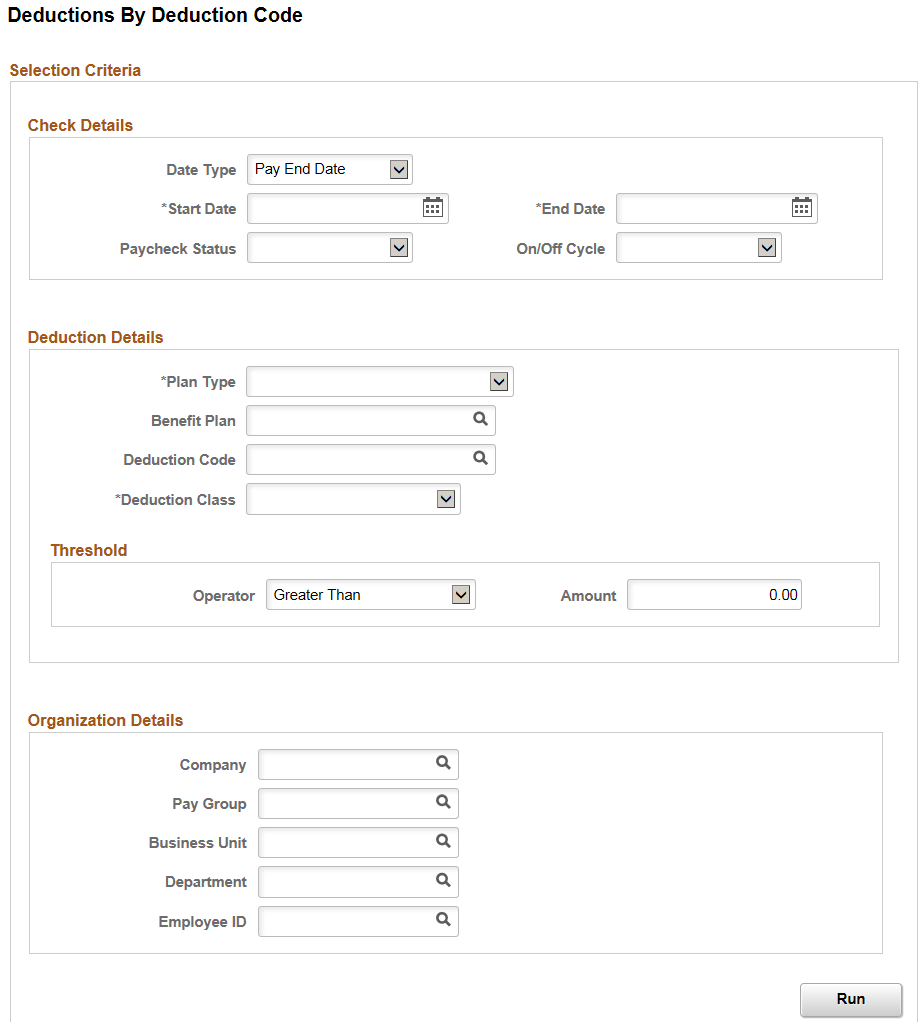
This example illustrates the Deductions By Company Page.
Field or Control |
Description |
|---|---|
Plan Type and Deduction Class |
Enter the plan type and deduction class for the deductions by company query to use. Note: In addition to the Start Date and End Date fields, the Plan Type and Deduction Class fields are required-entry fields on the Deductions By Company run control page. |
Benefit Plan or Special Process |
Benefit Plan is the default field for all plan types except General Deduction. If you select General Deduction in the Plan Type field, the system changes the Benefit Plan field to the Special Process field, where the available values are: Bond, Garnishment, and Union Dues. |
The Deductions By Company pivot grid enables you to view deductions information by company. Enter criteria for the deductions by company and click Run to generate the pivot grid based on that criteria.
Use the Deductions By Deduction Code page (PY_DED_PG) to generate the Deductions By Deduction Code pivot grid where you can view deductions information by deduction code.
Navigation:
Select the Reports tab. Click the Deductions By Deduction Code link in the Payroll Analytics folder on the Reports/Processes pagelet.
This example illustrates the Deductions By Deduction Code Page.
Enter criteria for the deductions by deduction code query to use, then click Run to generate the pivot grid based on that criteria.
The Deductions By Deduction Code pivot grid enables you to view deductions information by deduction code. Enter criteria for the deductions by deduction code query to use, and click Run to generate the pivot grid based on that criteria.
Use the Earnings By Company page (PY_EARNS_PG) to generate the Earnings By Company pivot grid where you can view information earnings information by company.
Navigation:
Select the Reports tab. Click the Earnings By Company link in the Payroll Analytics folder on the Reports/Processes pagelet.
This example illustrates the Earnings By Company Page.
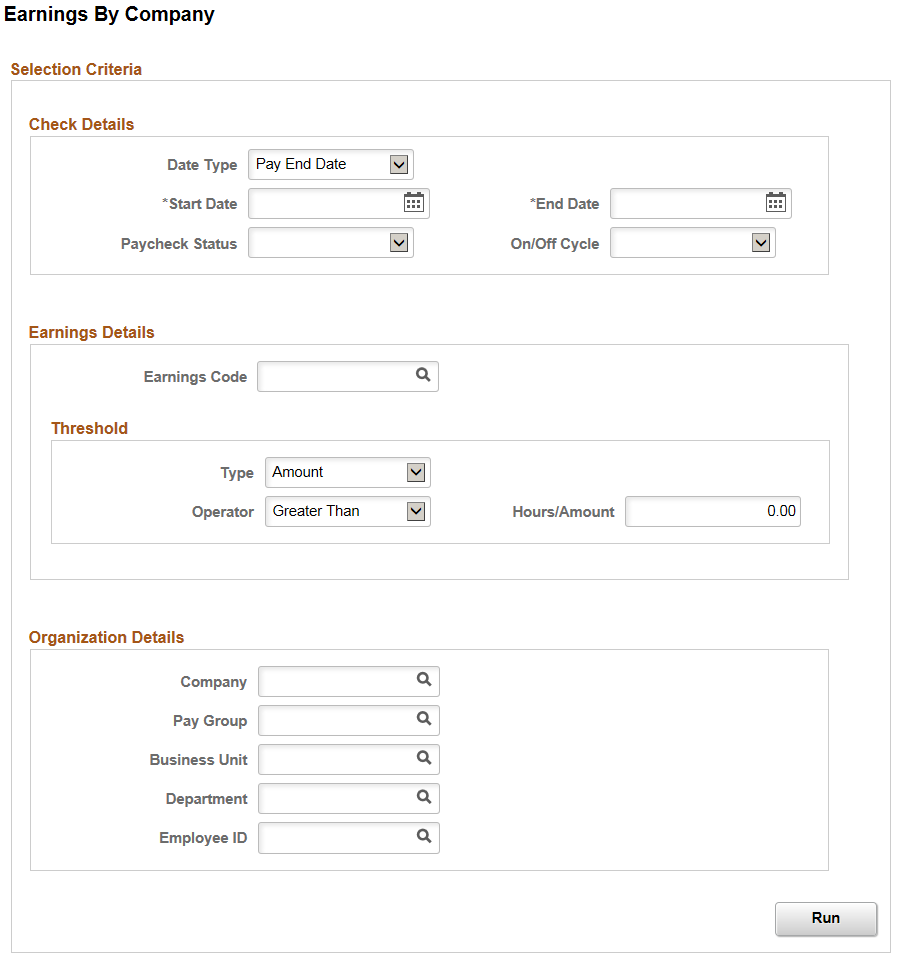
Enter criteria for the earnings by company query to use, then click Run to generate the pivot grid based on that criteria. Earnings by company information includes confirmed and unconfirmed earnings.
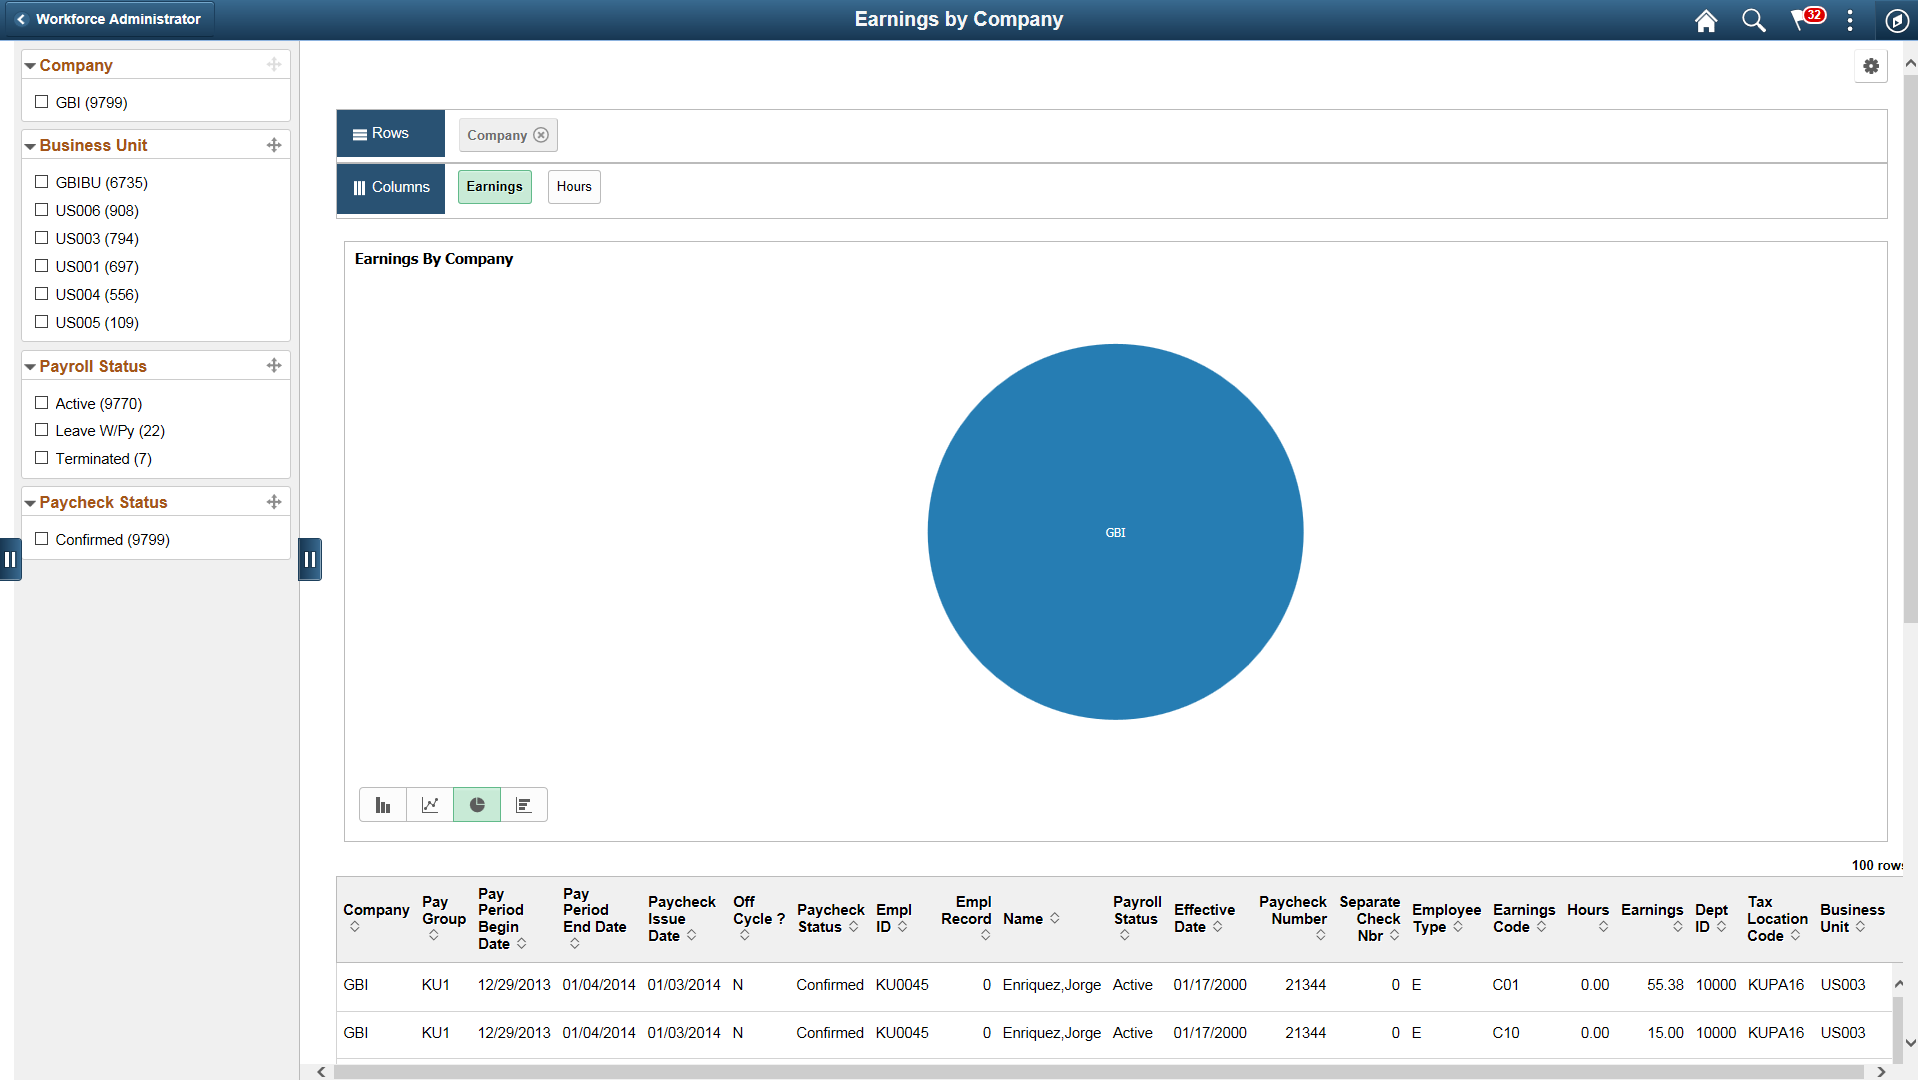
The Earnings By Company pivot grid enables you to view earnings information by company.
This example illustrates the Earnings By Company Pivot Grid .
Use the Earnings By Earnings Code page (PY_EARNS_PG) to generate the Earnings By Earnings Code pivot grid where you can view earnings information by earnings code.
Navigation:
Select the Reports tab. Click the Earnings By Earnings Code link in the Payroll Analytics folder on the Reports/Processes pagelet.
This example illustrates the Earnings By Earnings Code Page.
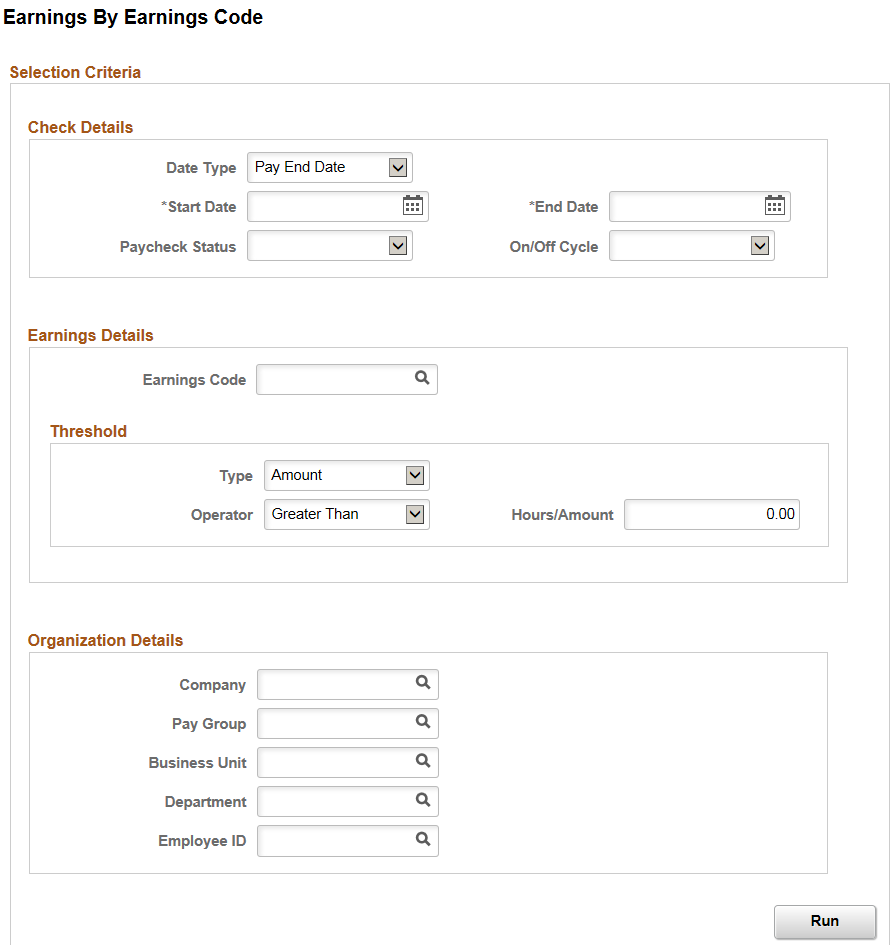
Enter criteria for the earnings by earnings code query to use, then click Run to generate the pivot grid based on that criteria. Earnings by earnings code information includes confirmed and unconfirmed earnings.
The Earnings By Earnings Code pivot grid enables you to view earnings information by earnings code.
This example illustrates the Earnings By Earnings Code Pivot Grid.
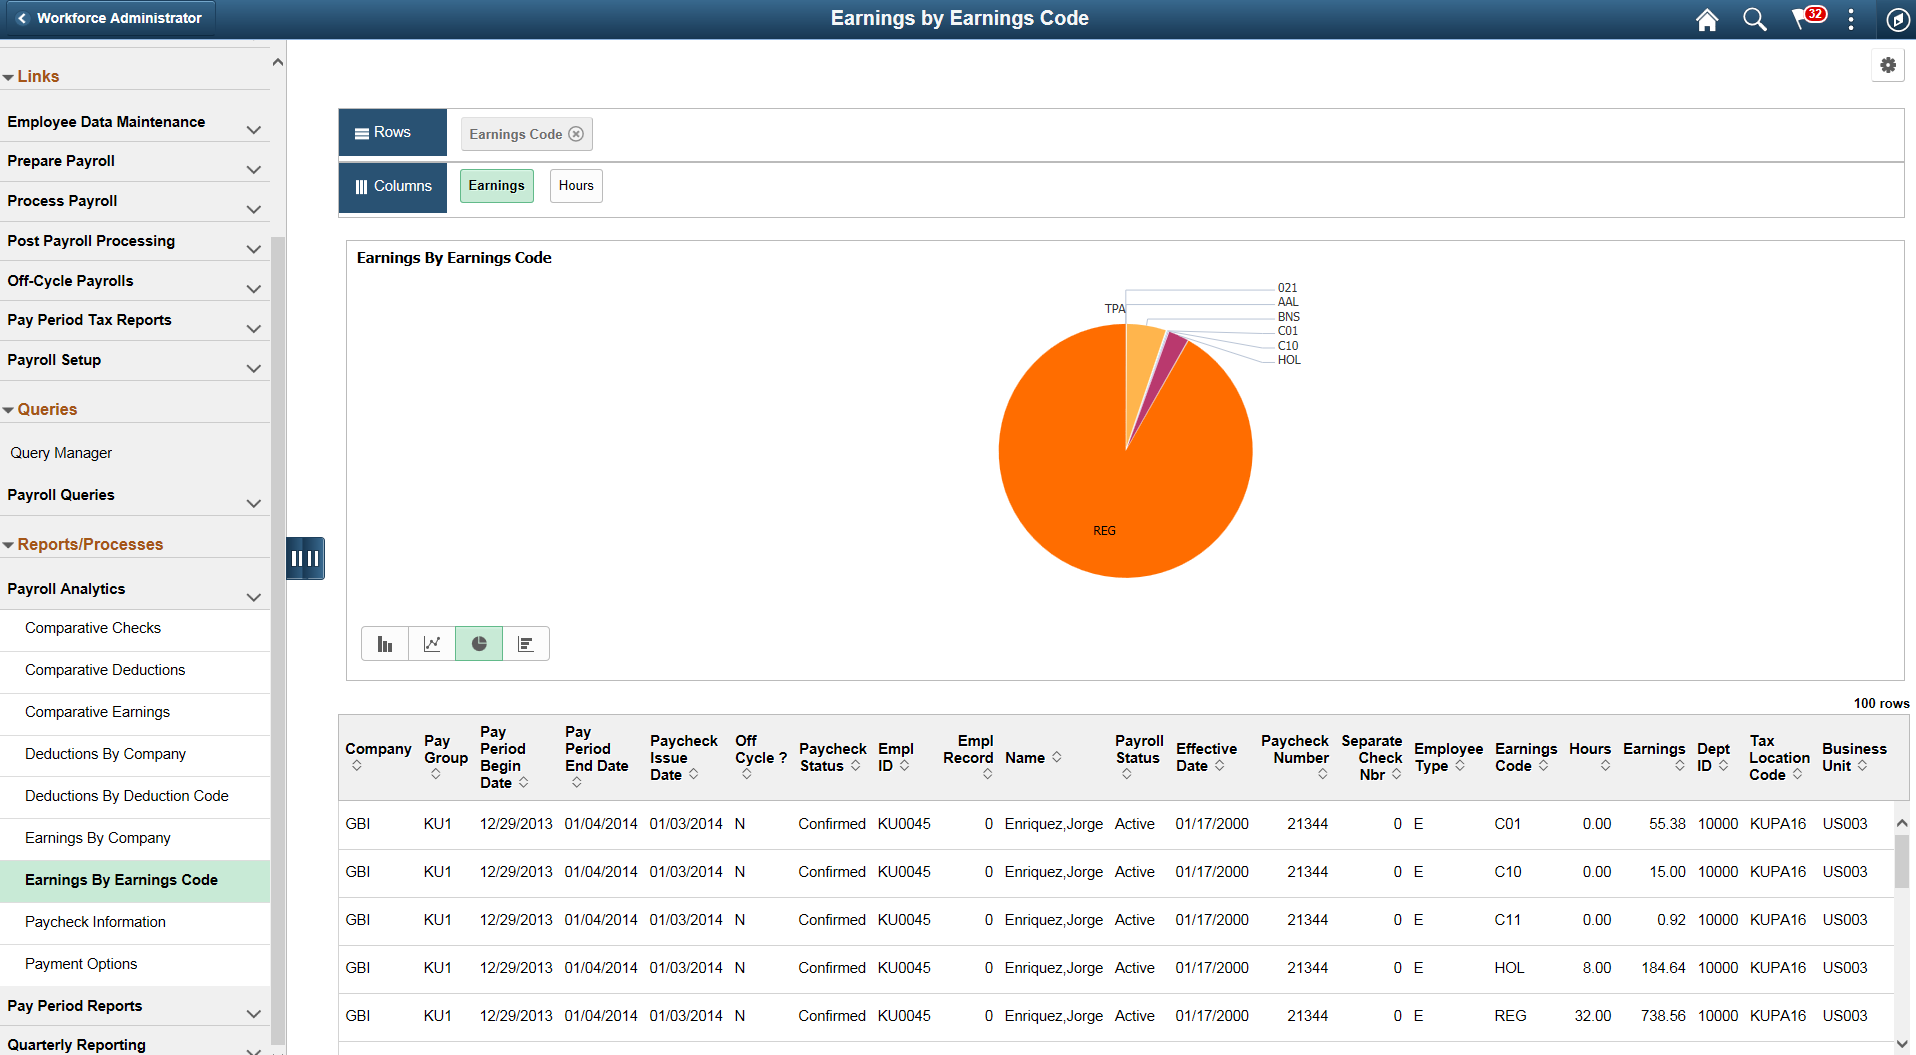
Note: The default rendering is a vertical bar chart. The example shown here uses the pie chart option instead.
Use the Paycheck Information page (PY_EE_CHK_PG) to generate the Employee Paycheck Information pivot grid where you can view current paycheck information.
Navigation:
Select the Reports tab. Click the Paycheck Information link in the Payroll Analytics folder on the Reports/Processes pagelet.
This example illustrates the Paycheck Information Page.
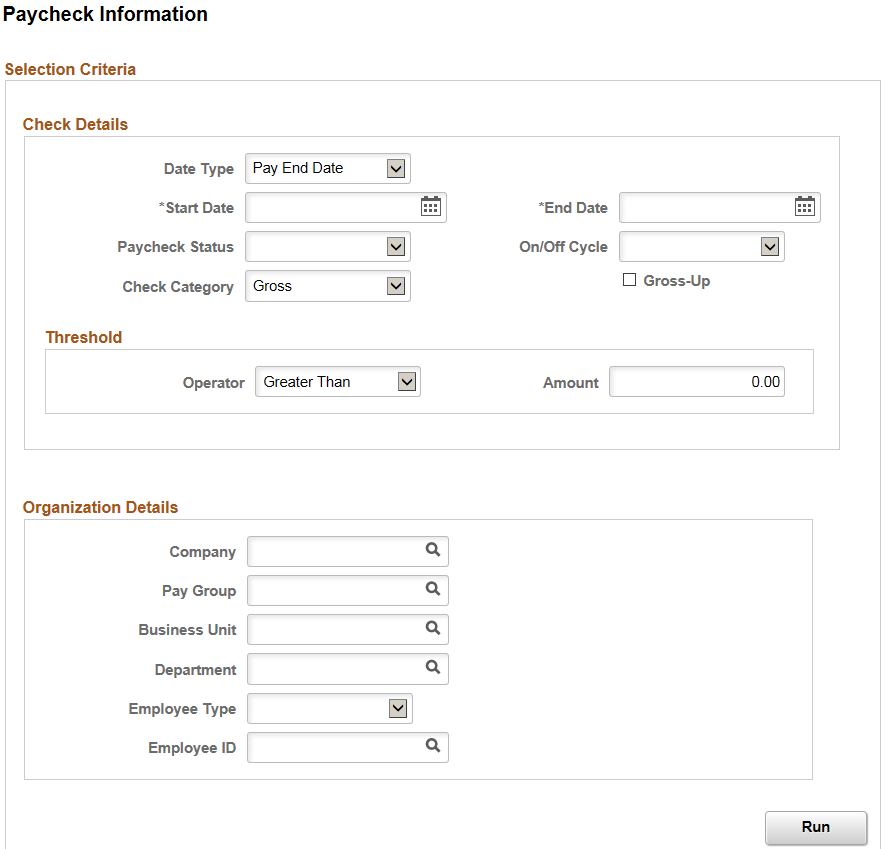
Enter criteria for the paycheck information query to use, then click Run to generate the pivot grid based on that criteria. With criteria entered, the query includes calculated and confirmed checks. If the criteria is left blank, the system searches for all types of paychecks.
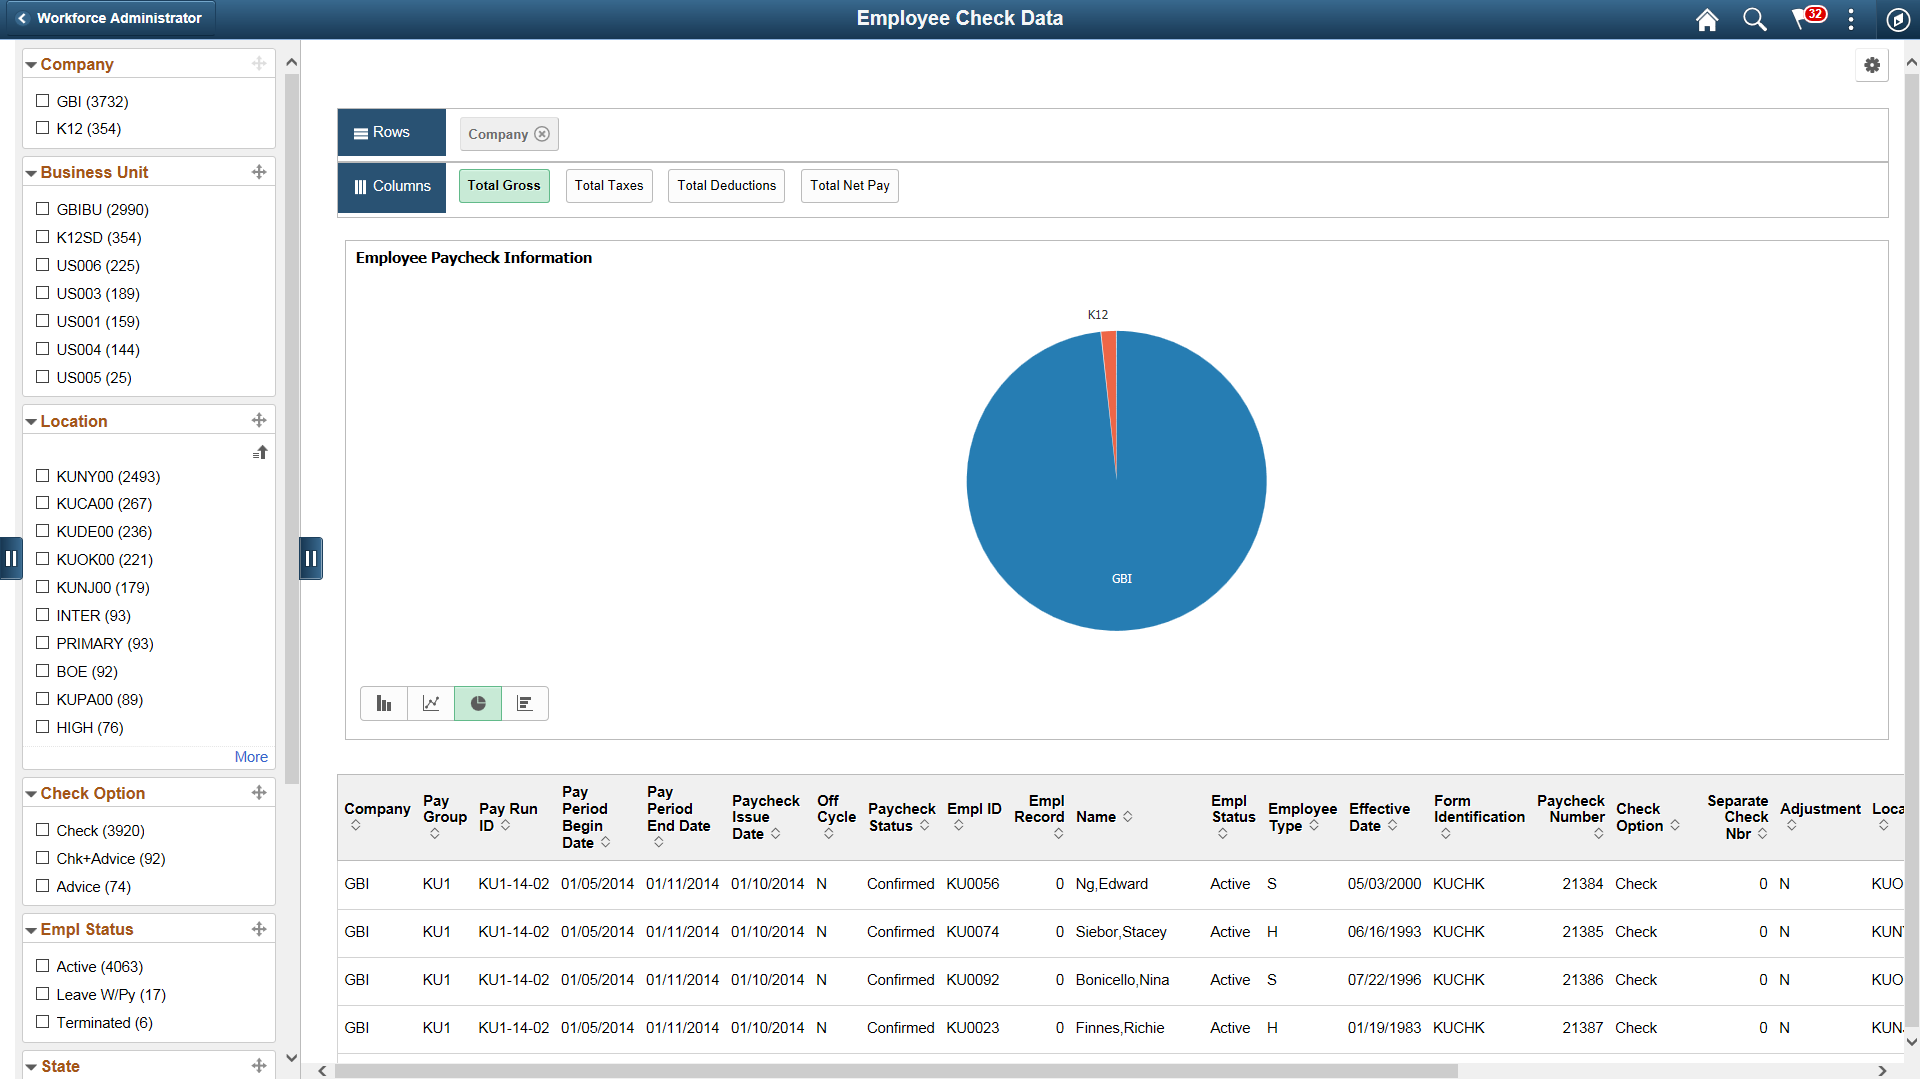
This example illustrates the Employee Paycheck Information Pivot Grid.
Use the Payment Options page (PY_PAY_OPT_PG) to generate the Payment Information pivot grid where you can view payment distribution information.
Navigation:
Select the Reports tab. Click the Payment Options link in the Payroll Analytics folder on the Reports/Processes pagelet.
This example illustrates the Payment Options Page.
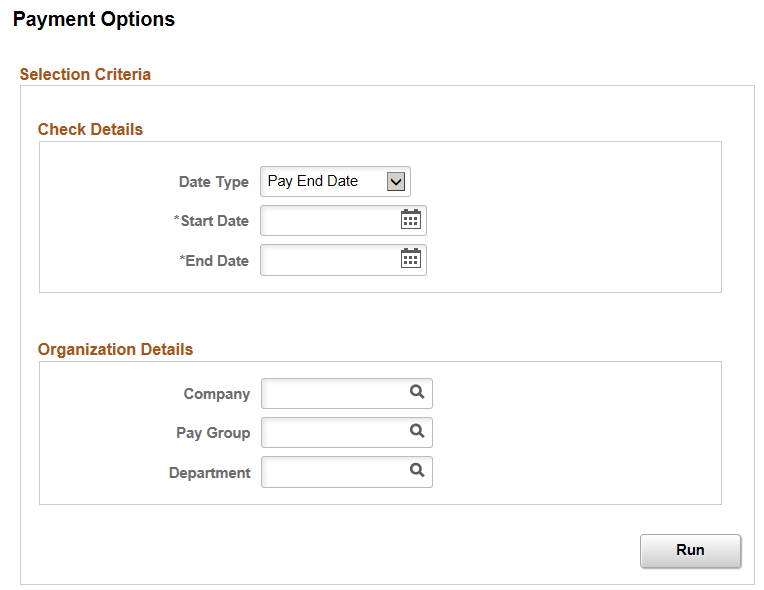
Enter criteria for the payment options query to use, then click Run to generate the pivot grid based on that criteria.
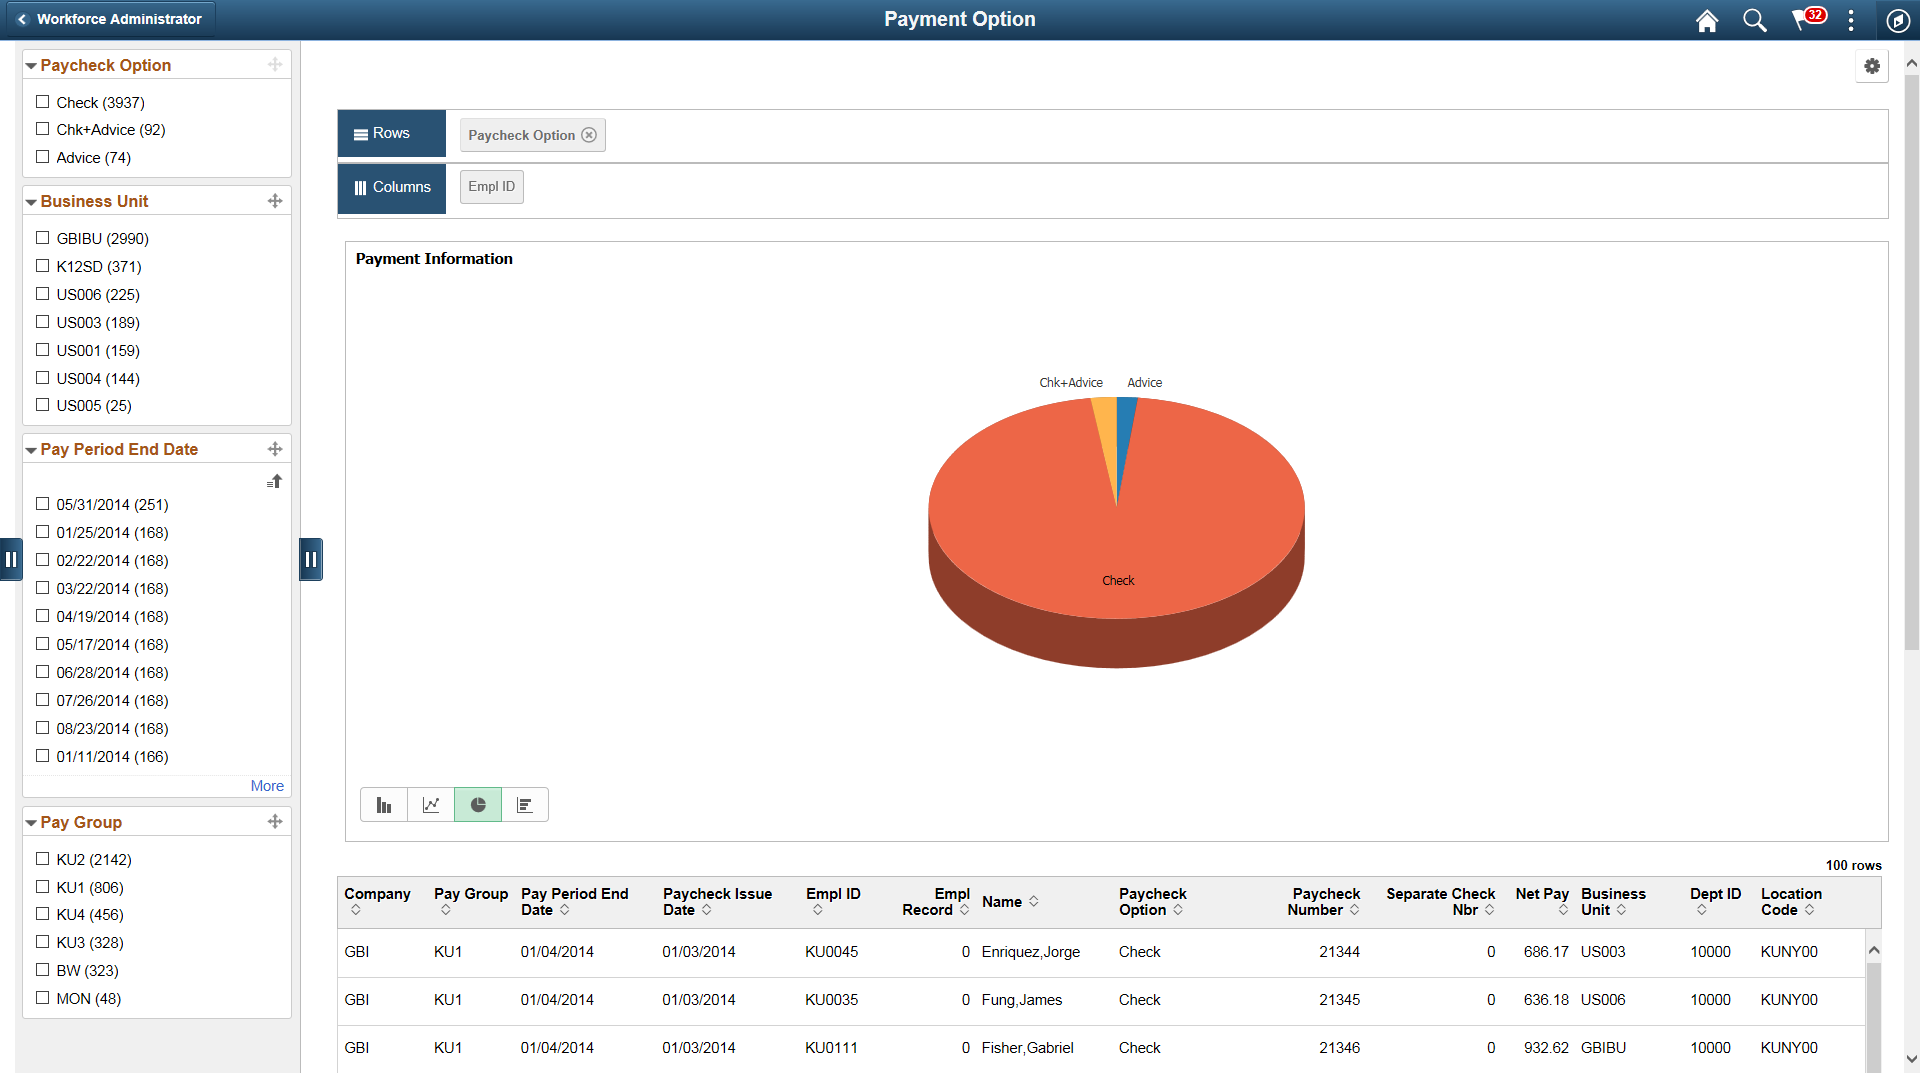
Use the Payment Information pivot grid to view paycheck options information.
This example illustrates the Payment Information Pivot Grid.