Working with Portfolio View Scorecards
A scorecard is a type of portfolio view you can use to analyze project data in a table with projects in rows and up to 30 data fields in columns. You can display scorecards on the Portfolio Analysis page, the Capacity Planning page, and the Portfolio View portlet, and choose the columns of information you want to display. A scorecard is beneficial when you want to analyze data in a spreadsheet-type format.
To assist with more sophisticated analysis of a set of projects, you can also use a scorecard to conduct a waterline analysis. A waterline is a visual modeling tool that ranks projects into two separate groups by sorting and applying a constraining limit.
It is also possible to edit some global and project data in a scorecard, such as project codes, user-defined fields, and responsible manager. Additionally, you can add projects with default data and delete projects directly from a scorecard.
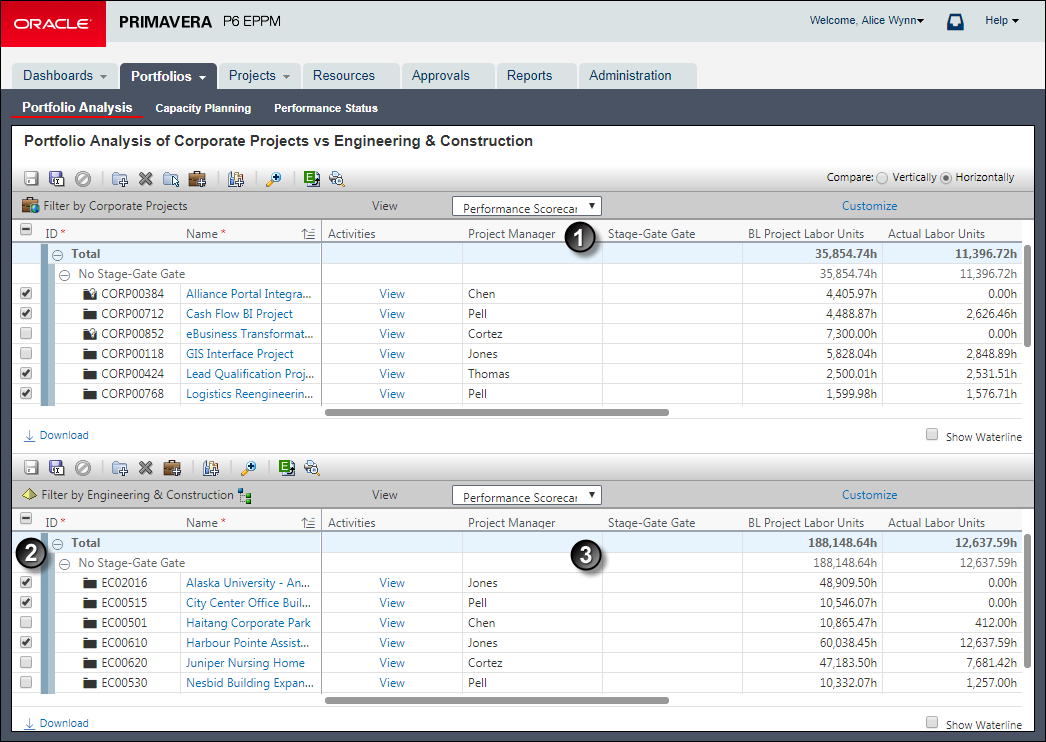
Table of Key Scorecard Elements
Item | Description |
|---|---|
Scorecard work area: The first scorecard will appear in this upper work area. | |
| Project Selection options: Select an option to add a project's data to the cumulative Total line. |
| Scorecard work area: The second scorecard will appear in this lower work area. In this example, the user has customized the view with a waterline. Use a waterline to analyze a project group by sorting projects into two separate groups based on a defined sorting and constraint limit. Projects above the waterline, displayed with a white background, are those that fall outside the constraint limit value; all other projects, displayed with a light blue background, appear below the waterline. |
Note: To support comparative analysis, the Portfolio Analysis work area is divided into two parts. The elements above generally appear within both parts.
More About Scorecards
You can save the same scorecard view used on the Portfolio Analysis page and display it in private or share it later in a portlet on a dashboard.
Note: The application also makes use of general tables of data also referred to sometimes as scorecards; however, they are not the same as your individually named portfolio view scorecards.
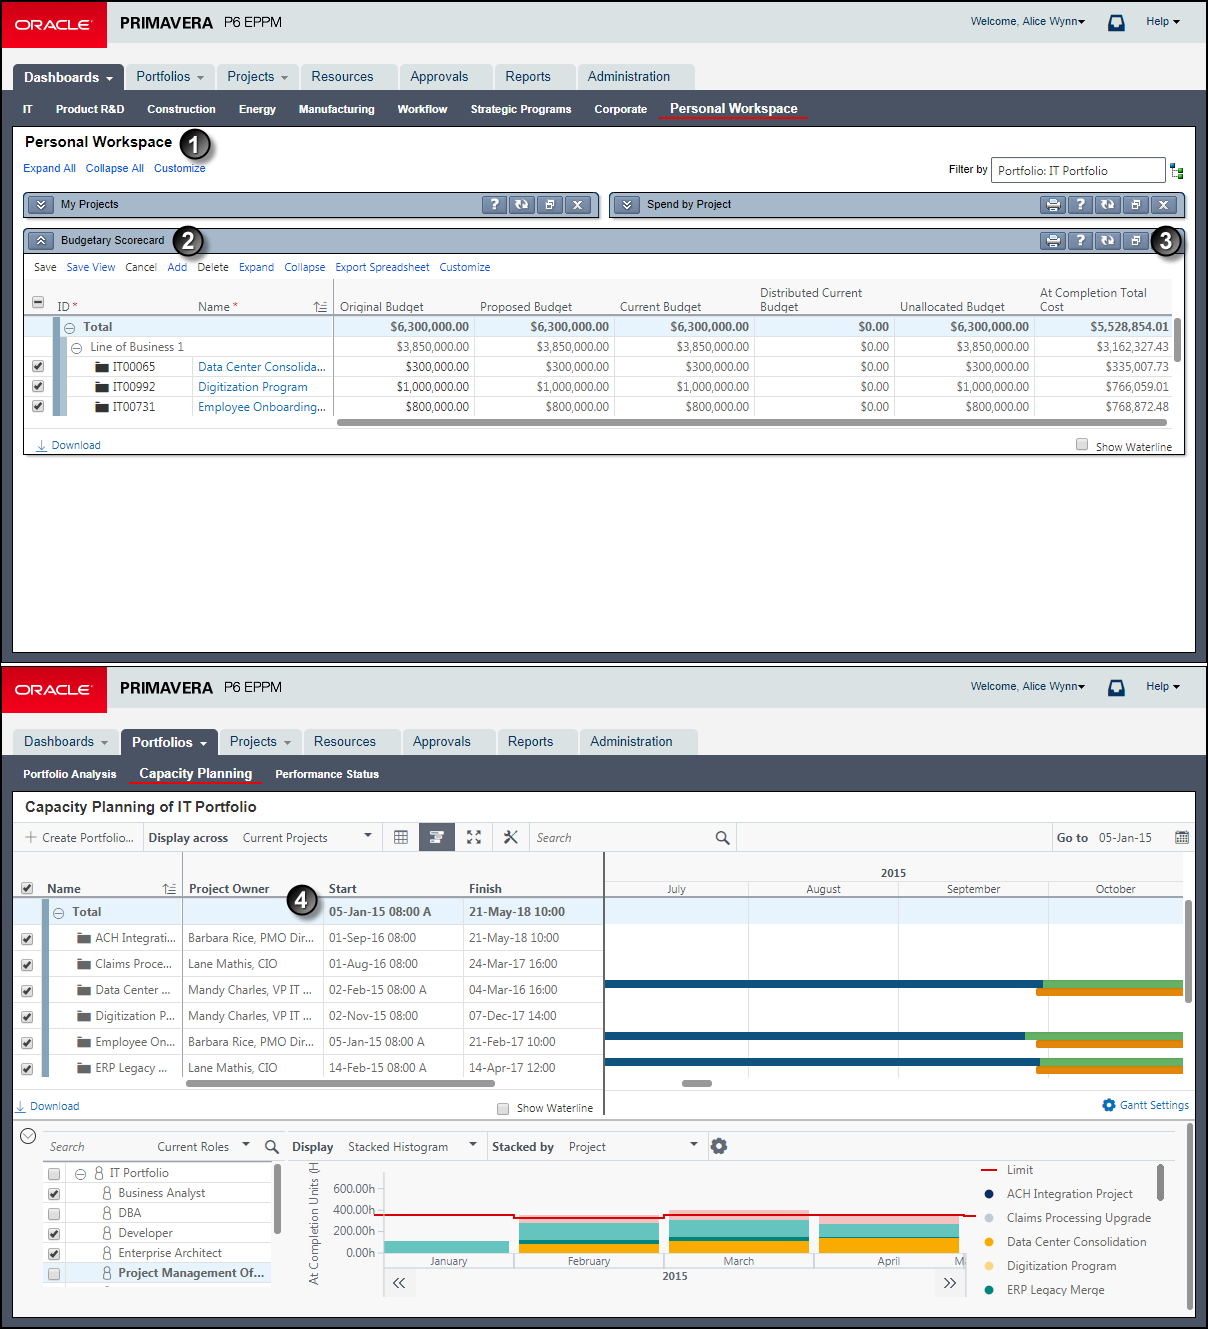
Table of Related Scorecards
Item | Description |
|---|---|
| Dashboard: The Personal Workspace dashboard. You can show portfolio views on private, multi-user, or global dashboards. |
| Scorecard in a portlet: The Budgetary Scorecard displays in a portlet on a dashboard. This example demonstrates a named portfolio view scorecard. |
|
|
| Scorecard on the Capacity Planning page: This example demonstrates a general table format also referred to as a scorecard; however, this is not a named portfolio view scorecard. |
Related Topics
Last Published Tuesday, November 26, 2024