Add a Drill Down Block to My Dashboard
You can add a Drill Down block that allows you to access greater levels of data detail.
Note: If a Drill Down block has Cost Sheet columns that are based on a formula, the data will not be displayed.
Example
The pie chart below shows data for the following two projects (Contract by Projects):
- Parking Extension
- Terminal Expansion
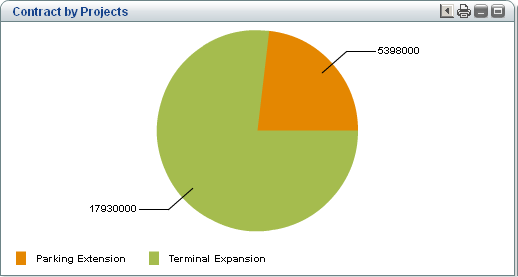
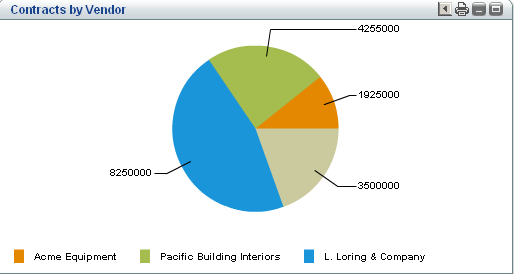
If you double-click the pie chart for the Terminal Expansion project, the amount associated vendors pie chart will display (greater levels of data detail), as shown (Contract by Vendor):
- Acme Equipment
- Pacific Building Interiors
- L. Loring & Company
Note: If you want to use filters on your dashboard blocks, you must first define a Drill Down block.
To add a drilldown block to your shell dashboard:
- On the Edit Dashboard window, click Add, and then select Drilldown. The Edit Drilldown Block window opens. Drilldown functionality is supported for charts only, and is not available for grids or tables. Drilldown will stop when a grid or table is encountered. See the first table below.
- Click Add to add Drilldown Details. The Edit Drilldown Details window opens. See the second table below.
- When complete, click OK, and click OK to exit the Edit Dashboard window.
This item | Does this |
|---|---|
Data Cube | Select the Data Cube definition to use. Data Cubes are queries that can be defined and reused to create charts on your dashboard. Your company administrator defines the Data Cubes. If the Data Cube is based on the Date Picker, which indicates the date and time that the relevant data was updated, the dashboard adjusts this information based on your date/time format preference and time zone. If the Data Cube is based on the Date Only picker, the dashboard displays only the date and adjusts it based on your date format preference. |
Block Title | Add a title for this block. |
Block Filter Elements | Group By elements from the Data Cube. This determines which columns from the Data Cube definition will be used to group data for filtering. |
In this field: | Do this: |
|---|---|
Title | Enter a title for the drilldown. |
Show Data From | Select the shells to use as data sources. |
Display Type | Select the type of display, for example, a bar chart. |
Source Grouped By | Select the columns from the Data Cube definition that will be used to group data. |
Output Type | Select Record Count or Summary Value. |
Report On | Select the columns from the Data Cube to be defined as Summary. |
Summary Type | Select the summary type. |
Show Result | Select the type of result, for example, Actual Value. |
Show Total | Select to show the totals for the data. |
Decimal Places | Select the number of decimal places. |
Use 1000 Separator (,) | Select to use a comma (,) as a separator. |
Negative Number Format | Specify the format for negative numbers. |
Currency Format | Select the currency format. |
Additional Information
If a Drill Down dashboard (Table or Grid) is set to show data from current shell and you create a report of your records, the report will contain all the pertinent records as hyperlinks, which can take you to the details of that record.
If a Drill Down dashboard (Table or Grid) is set to show data from sub-shells and you create a report of your records, the report will contain all the pertinent records without any hyperlinks, by design.
Last Published Thursday, February 19, 2026