Analyzing Contracts Using PeopleSoft Insights
This topic displays and explains how to analyze Contracts data using PeopleSoft Insights dashboards.
Use these pages to analyze Contracts using PeopleSoft Insights dashboards.
|
Page Name |
Definition Name |
Usage |
|---|---|---|
|
Provide visualization for customer's active contracts. |
Use the Contract Analytics dashboard to provide visualization for customer's active contracts.
These visualizations are forward looking, identifying lines of business, schools, and areas of research that are expanding and others that are shrinking. Visualizations include contract duration and contract value helping to identify customers and agencies issuing larger contracts with longer periods of performance.
Select the Contract Analytics tile.
This example illustrates the fields and controls on the Contract Analytics Page. You can find definitions for the fields and controls later on this page.
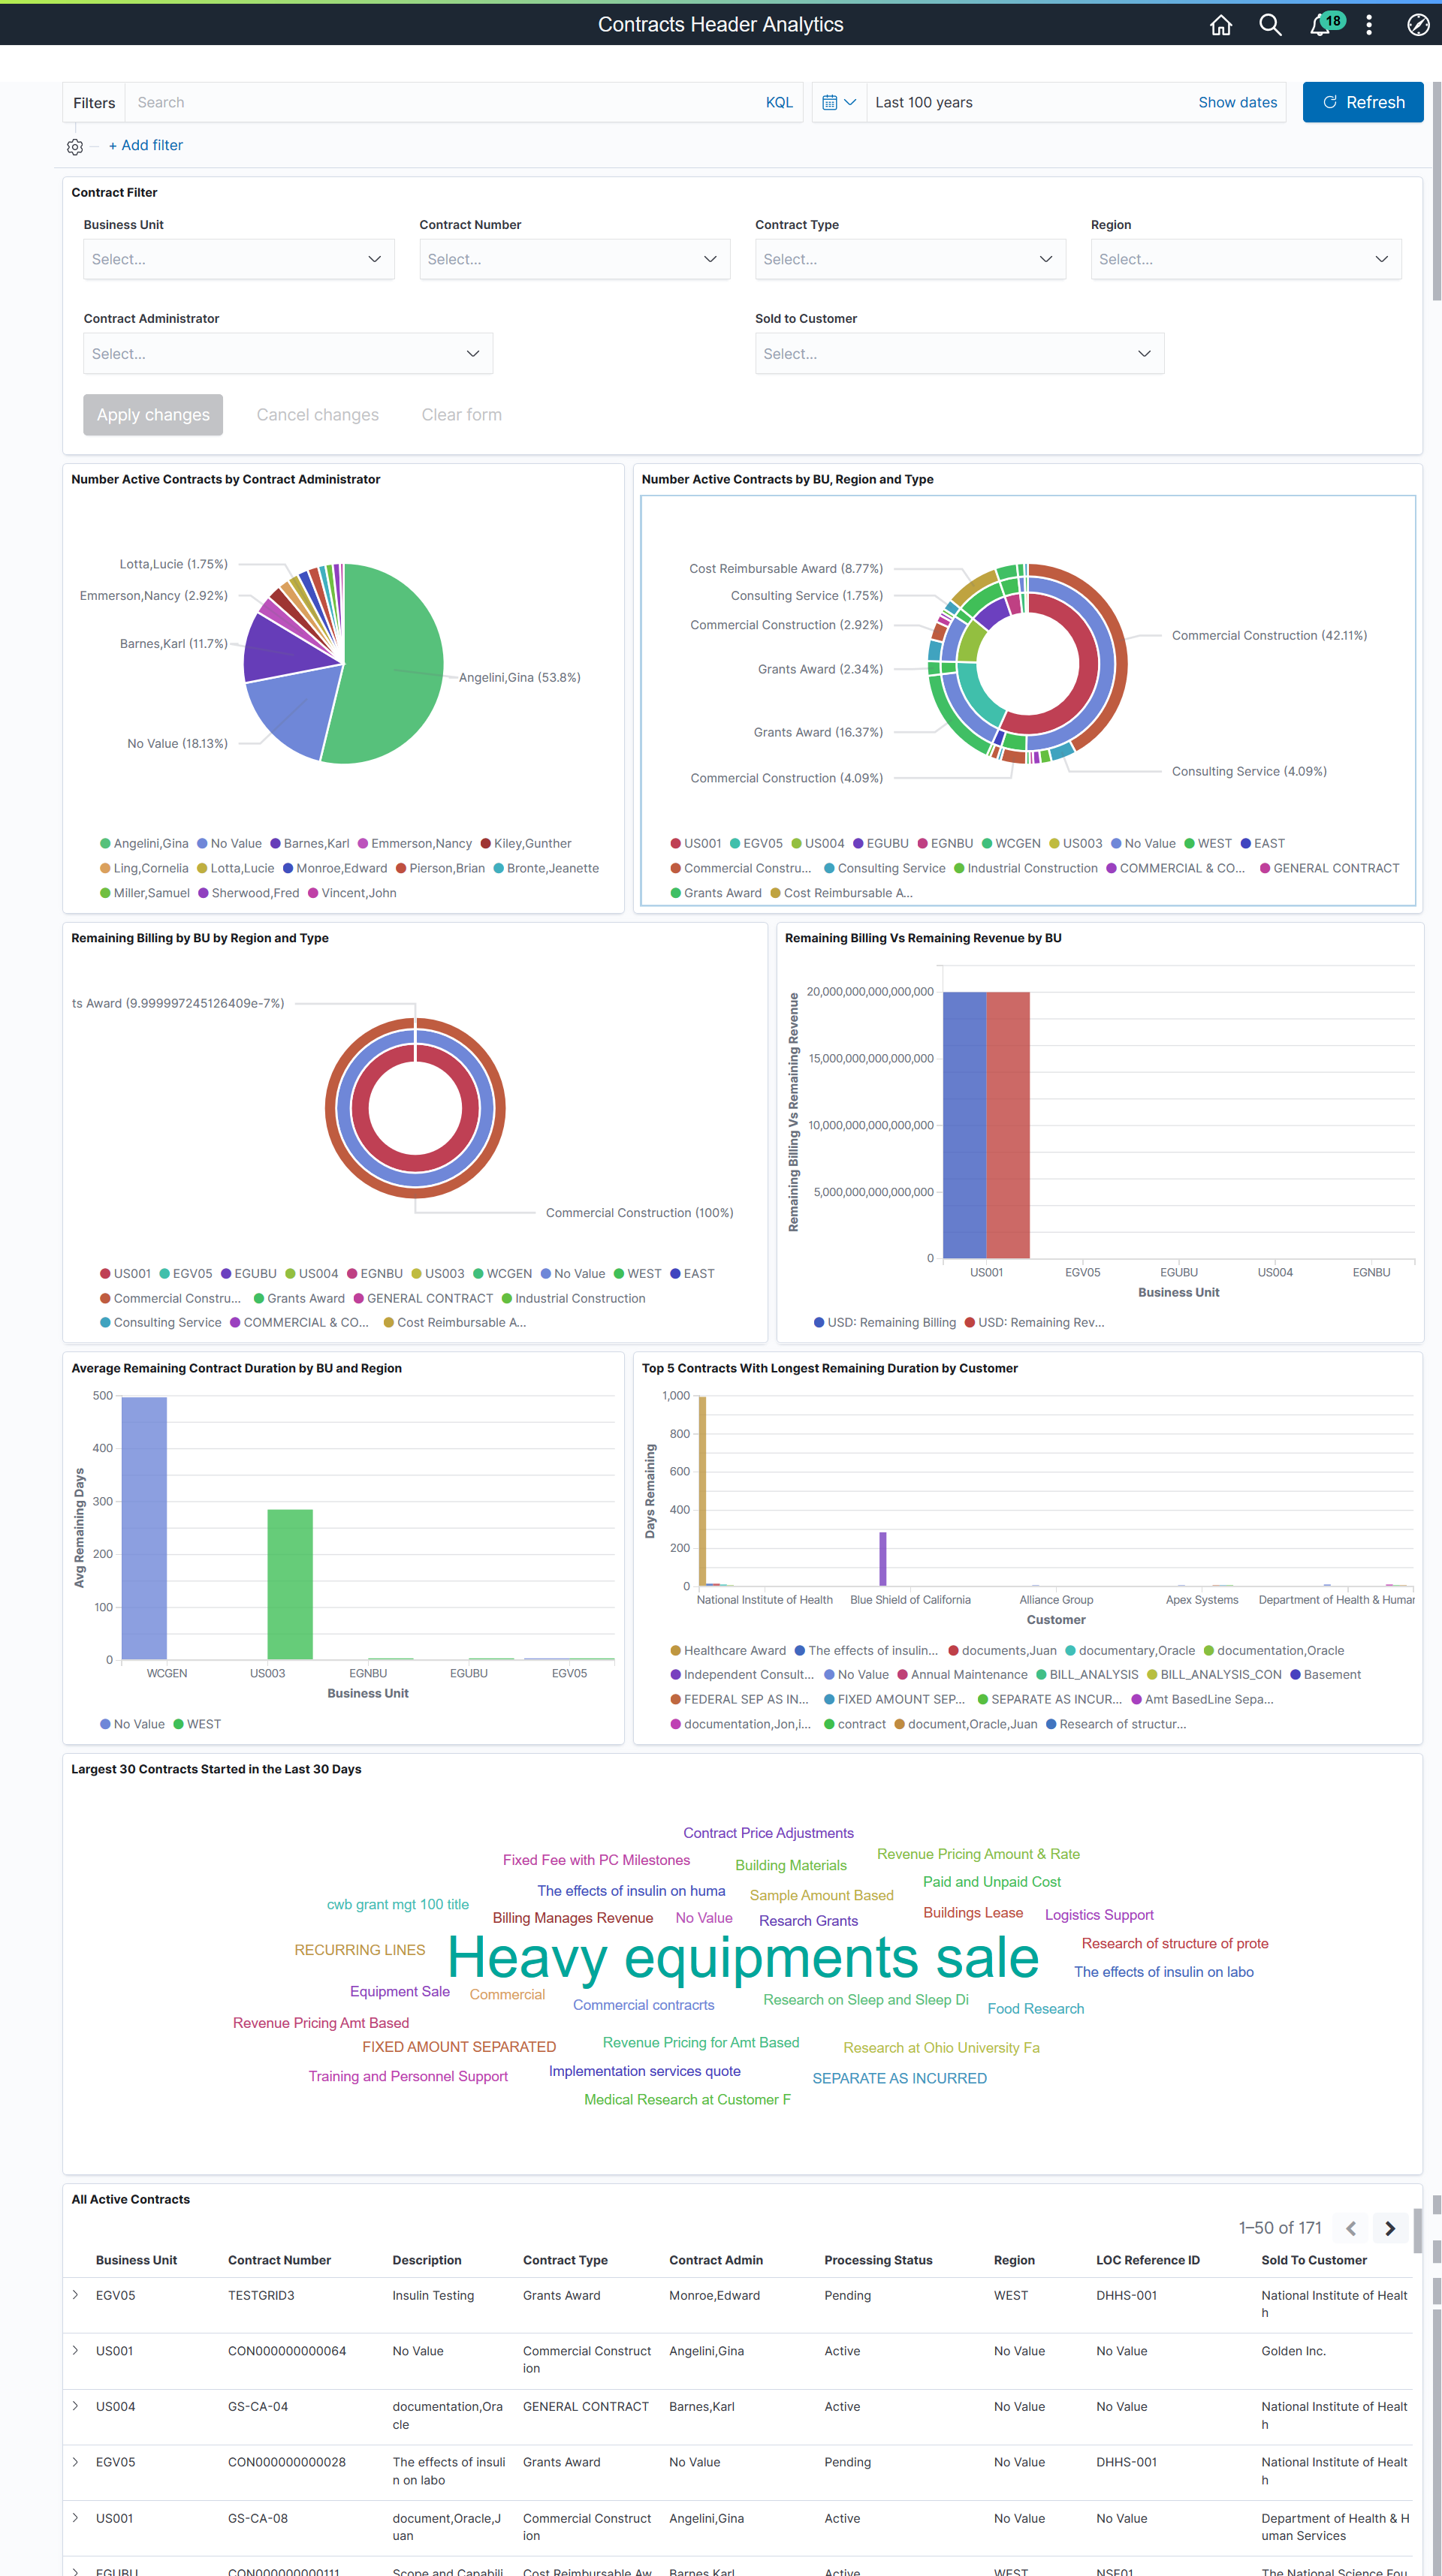
Data and visualizations displayed can be filtered based on the defined filters such as Business Unit, Contract Number, Contract Type, and Region. Only active contracts are considered for the analysis. Visualizations in the dashboard focus on the number, size, and duration of the active contracts. Users can drill down to individual contract details by selecting any active contract in the All Active Contracts grid. Data can be filtered by selecting any specific portion of the visualization.
|
Field or Control |
Description |
|---|---|
|
Filters |
Search for available filters or add additional filters by clicking the Add filter link. |
|
Contract Filter |
Select suitable filter values based on which data and visualization is displayed in the dashboard. Available filters are Business Unit, Contract Number, Contract Type, Region, Contract Administrator, and Sold to Customer. |
|
Apply Changes |
Click to apply the selected filter criteria. |
|
Largest 30 Contracts Started in the Last 30 Days |
This tag cloud shows the 30 largest 'recent contract wins'. It includes contracts with the largest total authorized billing amount that have started in the last 30 days. The tag cloud shows the contract description. |
|
All Active Contracts |
This section displays all active contracts details in grid format. Select an item in the grid to apply a filter to the grid and to the other visualizations. |
Other visualizations that are part of this dashboard are:
Number Active Contracts by Contract Administrator.
Number Active Contracts by BU, Region and Type.
Remaining Billing by BU by Region and Type.
Remaining Billing Vs Remaining Revenue by BU.
Average Remaining Duration by BU and Region.
Top 5 Contracts With Longest Remaining Duration by Customer.
Active contracts are defined in the supporting PSQUERY CA_SRCH_CONTR_HDR_KIB. Remaining Days/Duration are calculated only if the end date exists for the contract. Remaining Billing is calculated as total authorized billing amount on the contract minus the amount already billed. Similarly, Remaining Revenue is calculated as total authorized revenue amount minus amounts already processed for revenue recognition. The Top 5 Contracts With Longest Duration visualization identifies the top 5 contracts with the longest remaining number days and the customer for each of those 5 contracts. The visualization also shows other long running contracts for that same customer.
Note: Ensure to enter unique descriptions for fields such as contract description and customer. Not doing so could impact certain visualizations by combining those contracts as a single item.