Viewing Average Days in Payables
This topic discusses how to view average days in Payables, personalize the average days pagelet, and view average days information by business unit.
|
Page Name |
Definition Name |
Usage |
|---|---|---|
|
AP_CFOP_AVG_MAIN |
View a bar graph that displays average days for the periods specified on the Average Days Personalization page. |
|
|
AP_CFOP_AVG_PERS |
Define default display information for the Average Days in Payables pagelet. |
|
|
AP_CFOP_AVG_DTLS |
View details of each period shown on the bar graph, such as the name of the business unit and the average days per business unit. |
Use the Average Days in Payables pagelet (AP_CFOP_AVG_MAIN) to view a bar graph that displays average days for the periods specified on the Average Days Personalization page.
Navigation:
Click the Personalize Content link on the PeopleSoft Home page.
Select Average Days in Accounts Payable.
This pagelet displays the average number of days it takes to pay invoices for the periods specified on the Average Days Personalization page. Average days are determined by calculating the difference between the invoice date and payment date on all paid vouchers for the specified periods.
Click a bar on the graph to view details.
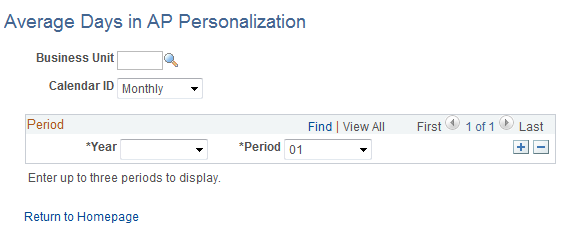
Use the Average Days in AP Personalization page (AP_CFOP_AVG_PERS) to define default display information for the Average Days in Payables pagelet.
Navigation:
Click the Customize icon on the Average Days in Payables pagelet.
This example illustrates the fields and controls on the Average Days in AP Personalization page. You can find definitions for the fields and controls later on this page.
Field or Control |
Description |
|---|---|
Business Unit |
Enter a business unit or leave the field blank to view average days for all business units. Leave the field blank to view all business units on the Average Days by Business Unit page. |
Calendar ID |
Select Annually, Monthly, or Quarterly. This will affect the type of period that appears in each Period field. |
Year and Period |
Define up to three accounting periods to display on the Average Days in Payables pagelet. |
Use the Average Days by Business Unit page (AP_CFOP_AVG_DTLS) to view details of each period shown on the bar graph, such as the name of the business unit and the average days per business unit.
Navigation:
Click a bar on the graph displayed on the Average Days in Payables pagelet.
This example illustrates the fields and controls on the Average Days by Business Unit page. You can find definitions for the fields and controls later on this page.
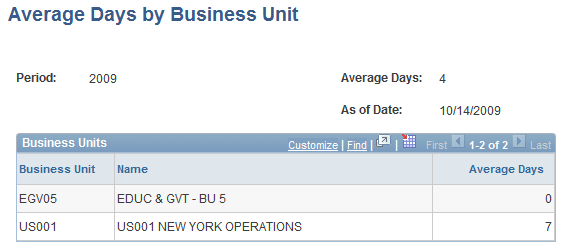
Note: The Business Unit field on the Average Days in AP Personalization page must be blank in order to access this page.
Field or Control |
Description |
|---|---|
Average Days |
Number of average days represented by a bar on the bar graph. |
Click the column headings to sort data in ascending or descending order.