Viewing Average Time to Resolve Deductions
This topic discusses how to view average time to resolve deductions and personalize the Average Time to Resolve pagelet.
|
Page Name |
Definition Name |
Usage |
|---|---|---|
|
AR_PE_DEDAVG_PAGE |
Display the average time to resolve a deduction over a user-defined period using a bar graph. |
|
|
AR_PE_DEDAVG_PRS |
Define default display information for the Average Time to Resolve Deduction pagelet. |
Use the Average Time to Resolve pagelet (AR_PE_DEDAVG_PAGE) to display the average time to resolve a deduction over a user-defined period using a bar graph.
Navigation:
Click the Personalize Content link on the PeopleSoft Home page.
Select Average Time to Resolve.
This pagelet uses a bar graph to display the average number of days it took to resolve deductions in each time period. For example, if each time period is 30 days, it shows the average resolution time over the last 30 days, the next 31 to 60 days, and so on.
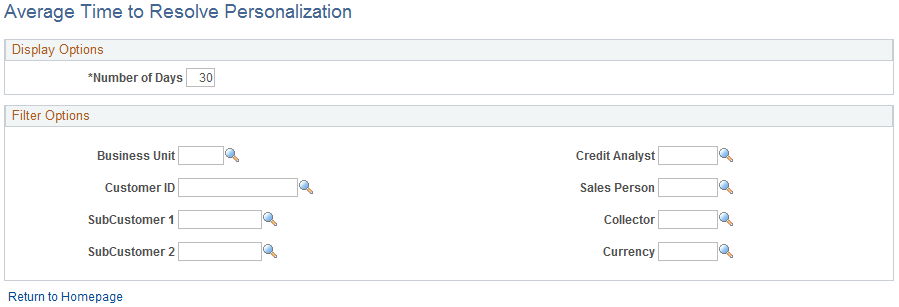
Use the Average Time to Resolve Personalization page (AR_PE_DEDAVG_PRS) to define default display information for the Average Time to Resolve Deduction pagelet.
Navigation:
Click the Customize Average Time to Resolve icon on the Average Time to Resolve Deduction pagelet.
This example illustrates the fields and controls on the Average Time to Resolve Personalization page. You can find definitions for the fields and controls later on this page.
Field or Control |
Description |
|---|---|
Number of Days |
Enter the number of days for each period in the Time Frame axis. |
Note: When you change any personalization options, you must run the Update Pagelet Statistics process for the pagelet to display the correct data.