Creating Demand Forecast Models
This topic provides an overview of the demand forecast model and discusses how to create Demand Forecast models.
|
Page Name |
Definition Name |
Usage |
|---|---|---|
|
RS_EXT_DMD |
Import and clean up external demand data for use in demand forecasts. |
|
|
RS_ADD_DMD |
Browse for demand from a predefined, filtered list to include in the demand forecast. |
|
|
RS_SEARCH_DMD |
Search for demand by using a set of multiple search criteria to include in the demand forecast. |
|
|
RS_DMD_SUMMARY |
View total time needed (in hours or days) and full-time resource count by application area. This page displays the total time required (in hours or days, with conversion to full-time resource count) by application area only for the selected forecast ID. |
|
|
RS_DMD_DETAIL |
Build and modify demand forecasts. |
|
|
RS_DMD_CHARTS |
View graphical summarized capacity information by demand category. |
|
|
RS_DMD_ACE_PAGE |
Analyze demand forecast data by supply categories by month. |
|
|
RS_DMD_ROLE |
View details by role and other demand data, and add new demand to the forecast. |
|
|
RS_ADD_NEWROLE_DMD |
For the demand, add, modify, or delete roles, and change the level of effort needed for each role. |
In an IT organization, frequent projections of upcoming work are often required in an effort to improve a company's overall operational efficiency. IT executives need foreknowledge of the potential projects that are coming, to be able to compare the demand on their resources with projections of how much work they can manage given their existing resource constraints.
Whether the demand is as minor as a project to relocate a server (tactical project) or as significant as a system implementation spanning several years (strategic program), the supply of resources must remain adequate to meet the demand for work to be completed. Capacity planning enables management to build supply forecasts based on existing headcount, along with engaging in what-if scenarios so they can determine the effect of adding or cutting resources, obtaining contractor services, and so on. Similarly, the process of collating demand into a demand forecast is also needed.
IT organizations receive demand on their time through multiple methods, ranging from projects to external demand data sourced out of third-party systems. Before creating the demand forecast, the setup of import data and clean up of that data must take place so that it can be used in the demand forecast.
The demand for resources is brought into the demand forecast from the following sources:
Pending and active projects (from PeopleSoft Project Costing).
External third-party systems using a generic Excel to Component Interface upload process.
After the preliminary demand forecast is populated with the raw data, you have the ability to add or delete demand from the list, categorize the entries in the list, and prioritize and rank the individual demand's importance for the organization. When you have verified and cleaned up the demand forecast, you can combine it with a similarly verified and clean supply forecast into a consolidated supply-demand scenario, where you can perform further what-if scenarios to determine the optimal balance of available resources and pending work for the upcoming projected time period.
Note: The maximum range for demand forecasting is 24 months. Although demand itself can span longer (for example, a five-year implementation project), the forecast only concerns itself with a maximum of two years, and will only pull effort data within that two-year span.
You can upload data with the Excel to Component Interface utility. The component interface used in this process is RS_LOAD_EXT_DMD. This component interface contains all the fields that are required to load demand data into the system.
You first load demand-related data into the Excel spreadsheet. After you run the Excel to Component Interface utility to load the data, you use the Load External Demand page to clean up the data and add any additional information that was not specified in the Excel to Component Interface process.
Demands loaded using the utility display in the Load External Demand page. The External Demand Interface staging table (RS_INTFC_DMD) contains all the rows that you entered in the spreadsheet. All rows are validated against the prompts in the External Search table (RS_DMD_SRCH_EXT), which is driven by business unit. Relevant rows that pass all validation tests are moved to the External Search table for more cleanup. You can add any demand, delete any demand, or update existing demands.
You use the Demand Forecast component (RS_FR_DEMAND) to create, view, and modify demand forecasts.
Note: All data in supply forecasts, demand forecasts, and consolidated scenarios is "point-in-time." This means that if additional resource pools or demand data changes or becomes available on the transactional side, it will not affect any existing forecasts or scenarios—unless you specifically choose to add them afterwards. In other words, forecasts are created based on supply and demand as of the date the forecast was created. If pools and capacity are added a week later, for example, that information does not appear in the supply forecast. You can manually add the supply but it does not automatically appear in the forecast.
Use the Load External Demand page (RS_EXT_DMD) to import and clean up external demand data for use in demand forecasts.
Navigation:
Note: You can load third-party data into a staging table by using the Excel to Component Interface spreadsheet, viewed through the RS_EXT_DMD_SRCH component, and validated so that it contains the proper information for enhanced analysis through the scenario component.
Field or Control |
Description |
|---|---|
Sequence Number |
Enter a unique number in the Microsoft Excel spreadsheet. Each batch sequence number is uniquely identified by a load description for every upload process. |
Load Description |
Enter a unique batch load description. You can vary the name of each run to distinguish the data during the upload process. |
Business Unit |
Enter a business unit to map external data to either through manual entry in the spreadsheet or at a later point in the during data scrubbing to drive SetID prompting. |
Demand ID |
Enter an ID, which the system stores in the External Demand Interface staging table. The system assigns items demand IDs during the load process. |
Demand Description |
Enter any text to identify the demand data row. |
Role SetID |
Enter the SetID for the resource role requested by the demand. |
Project Role |
Enter the role requested by the demand. |
Program |
Enter a higher level categorization of Projects (this is an existing PeopleSoft Program management field). This field is optional. |
Effort |
Enter the estimated length of time needed for this demand row for this role. |
UOM (unit of measure) |
Specify corresponding effort capacity in Days or Hours. |
Application Area |
Enter the group to which the demand belongs, such as IT, Marketing, and so on. Oracle strongly recommends that you populate this field in order to view the data in summarized format in the demand forecast. |
Application |
Enter an application to describe the system or application to which the demand applies, such as Program Management, Project Costing, and so on. |
Release |
Assign a release to demand lines to account for periodic releases. |
Category |
Enter a category to categorize the demand, such as Operational or Strategic. |
Requester |
Enter the original requester of the project request. |
Request Date |
Enter the date that the project request was first submitted. |
Status |
Indicates whether a project is already active and in operation, as opposed to being in the proposal state. This helps you to determine whether projects that are currently running need to be canceled. Values are:
|
Message |
Describes the data row's status after the load process. |
Add Demand |
Click to add a row in the Demand Data Cleanup grid. You can enter any demand. The Demand ID is generated when a new row is added to the grid. |
Validate Demand |
Click to validate the demand data for business unit, required key fields, and translate values. |
Load Demand |
Click to retrieve all the rows from the External Demand Interface staging table. The process populates the Demand Cache table (RS_DMD_CACH) with all the demand data in monthly buckets and deletes the loaded rows from the interface grid in the page. |
Note: When entering data in the Load External Demand Data component interface (RS_LOAD_EXT_DMD), it is important to ensure that the LINE_NBR field is not selected for input because it is an auto-generated field; do not enter any value in it.
See the product documentation for PeopleTools: Component Interfaces
Use the Demand Forecast - Browse For Demand page (RS_ADD_DMD) to browse for demand from a predefined, filtered list to include in the demand forecast.
Navigation:
Select Add a New Value, Demand Forecast - Browse for Demand
Click the Continue Selecting Demand link in an existing demand forecast.
This example illustrates the fields and controls on the Demand Forecast - Browse for Demand page. You can find definitions for the fields and controls later on this page.
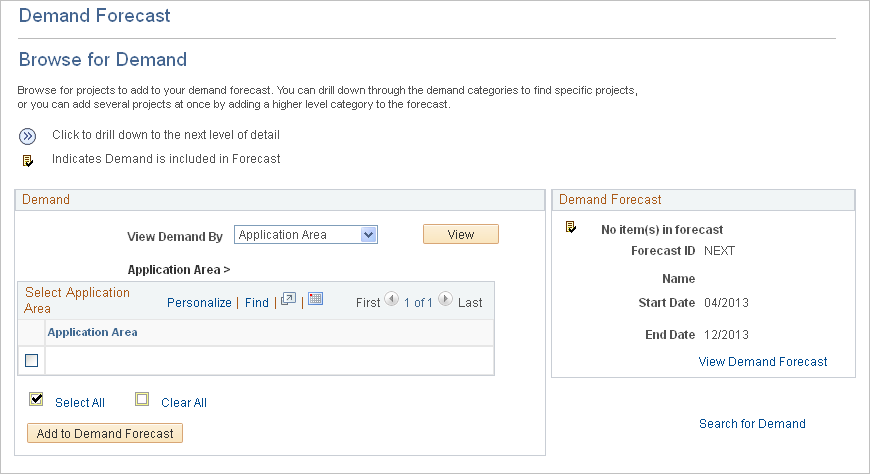
Demand
Field or Control |
Description |
|---|---|
View Demand By |
Filter your demand by selecting one of these options:
After you select a filter to view the demand, click the View button to display the demand. When you are satisfied with the demand, click the Add to Demand Forecast button for the system to add the demand. Select the demand row that you want to add to the forecast. You can click a link to an individual demand and select projects to add to the forecast. Note: The demand forecast categorizes demand by application area, release, and program, although none of those fields are required for projects. Therefore, if you do not specify values in these fields, you cannot comprehensively use the Demand Forecast - Browse for Demand page because projects without those fields specified will not be visible. The only way you would be able to select projects to add to a demand forecast is to access the Demand Forecast - Search page where all projects within the demand forecast date range are accessible—whether or not application area, release, or program are specified. |
|
Click this icon to drill further down to the individual demand level and select projects individually to add to the forecast. For example, click the icon to drill down from application area to application, and then to individual demand. |
Add to Demand Forecast |
Click to add the selected demand to the demand forecast. |
Search for Demand |
Click this link if the Demand group box does not provide the appropriate information and you need to perform a more detailed search. |

Demand Forecast
This group box displays the forecast ID, name, and date range in MM/YYYY format.
Field or Control |
Description |
|---|---|
View Demand Forecast |
Click to access the Demand Forecast Summary page and view total time needed and full-time resource count by application area. |
Search for Demand |
Click to access the Demand Forecast - Search page and search for demand by using multiple search criteria. |
Use the Demand Forecast - Search page (RS_SEARCH_DMD) to search for demand by using a set of multiple search criteria to include in the demand forecast.
Navigation:
Click the Search for Demand link on the Demand Forecast - Browse for Demand page.
This example illustrates the fields and controls on the Demand Forecast - Search page.
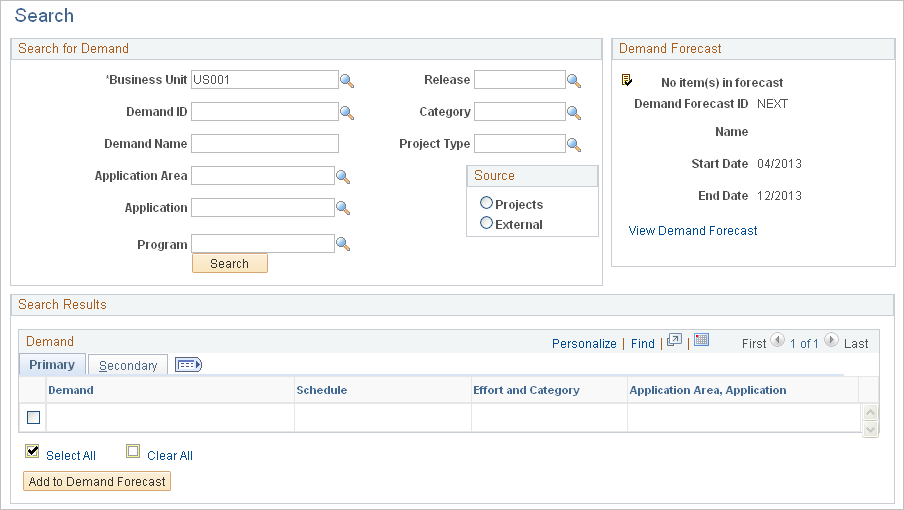
This page contains the results of the initial basic search. You can further modify the search parameters, and can search as many times as necessary to find the appropriate demand data.
The fields in the Demand grid on this page are the same as the fields on the Demand Forecast Details page, which is discussed in this topic.
Use the Demand Forecast Summary page (RS_DMD_SUMMARY) to view total time needed (in hours or days) and full-time resource count by application area.
This page displays the total time required (in hours or days, with conversion to full-time resource count) by application area only for the selected forecast ID.
Navigation:
Click the View Demand Forecast link on the Demand Forecast - Browse for Demand page.
This example illustrates the fields and controls on the Demand Forecast Summary page. You can find definitions for the fields and controls later on this page.

Field or Control |
Description |
|---|---|
Continue Selecting Demand |
Click to access the Demand Forecast - Browse for Demand page and add demand data to the forecast. |
Demand Analysis |
Click to access the Demand Analysis page to perform further analysis. Perform these actions for all months (month by month), and one month at a time for each month in the forecast. |
Demand Summary Charts |
Click to access the Demand Summary Charts page and view graphical representations of the selected demand data. |
Demand Summary
View the total effort required (in hours or days) with by application area. The system calculates the number of full-time resources needed.
Total effort is based on the project calendar set for the demand (or for the external demand, using the default project calendar for that business unit), and is calculated using the number of days specified for each role on the project in the Assignment Schedule group box on the Resource Details page in PeopleSoft Program Management, less weekends and holidays. The system calculates full-time resources by dividing the effort by the number of days per month for a full-time resource (as defined during the capacity planning setup in PeopleSoft Resource Management).
Note: The demand forecast first categorizes demand by the Application Area field. On this page, all demand is summarized at the application area. Any demand that does not have application area specified, will not be part of the demand summary; it will not display nor be part of the total full-time resource and capacity.
Demand that does not have application area specified is accessible on the Demand Forecast Details page.
Click Save Forecast to save the forecast, and to populate the lower half of the page with values in these fields:
Created By
Updated By
Created On
Updated On
Use the Demand Forecast Details page (RS_DMD_DETAIL) to build and modify demand forecasts.
Navigation:
. Select the Demand Forecast Details tab.
This example illustrates the fields and controls on the Demand Forecast Details page. You can find definitions for the fields and controls later on this page.

Note: Many of the fields on this page behave the same as fields on the Load External Demand page.
Field or Control |
Description |
|---|---|
Rank |
This is a sequencing field in which you can enter a number to rank demand in order of importance. Two demand rows in the same demand forecast can not have the same ranking. You do not have to rank all demand rows. You can leave gaps between ranking numbers; for example, you can assign a rank of 1, 2, and 4, but not 3. |
Priority |
Assign a value of Critical, High, Medium, or Low to demand rows for informational purposes only. No processing is done on these fields. |
Demand |
Displays the demand ID that is a concatenation of the project ID or external demand ID, and the demand description. Click a demand ID link to access the Demand Forecast - Demand Details page to view details of the associated demand row, and modify demand information for the forecast. Note: Changing the value of any of these demand details fields does not change the values on the actual project in the system. These demand detail values are used only in this forecast. |
Schedule |
Displays the demand start and end dates, release, and status. For example: 2007–01–01 2007–12–31 Release 9.0 Pending |
Effort and Category |
Displays the estimated length of time needed for this demand row for this role. This is a concatenation of effort, unit of measure, and category. Category is specified on the Project Definitions - General Information page. |
Application Area, Application |
Displays the application area and application to which the demand applies. Application and application area are specified on the Project Definitions - General Information page. |
Demand |
Displays a concatenation of the demand ID and the demand description. For example: M000397 Bulk Mailer Upgrade |
Business Unit |
Displays the demand project business unit. |
Program |
Displays a PeopleSoft Program Management field that reflects a higher-level categorization of projects and project requests. |
Project Type |
The project type is specified on the Project Definitions - General Information page. |
Demand Source |
Displays the source of the demand data. |
Requested by |
If the project came from a project request, this field displays the requestor of the project request and the original creation date of the request. If the project was not created from a project request, this field displays the user ID that created the project. |
Add New Demand |
Click to access the Demand Forecast - Demand Details page and add demand information for the forecast. |
Remove From Forecast |
Click to delete the selected demand from the Demand Detail table and Demand Forecast Cache table. |
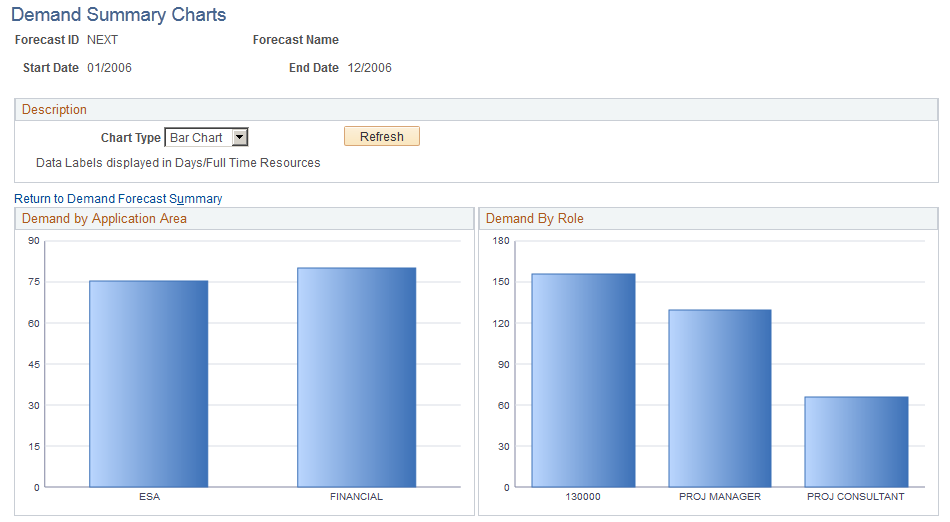
Use the Demand Summary Charts page (RS_DMD_CHARTS) to view graphical summarized capacity information by demand category.
Navigation:
Click the Demand Summary Charts link on the Demand Forecast Summary page.
This example illustrates the fields and controls on the Demand Summary Charts page. You can find definitions for the fields and controls later on this page.
This example illustrates the fields and controls on the Demand Summary Charts page (2 of 2). You can find definitions for the fields and controls later on this page.

Demand by Application Area: Displays the total demand for each application area.
Demand by Role: Displays the total demand for each role.
Demand by Release: Displays the total demand for each release.
Demand by Priority: Displays the total demand for each priority.
Adjacent to each pie chart section is the total effort (in hours or days), full-time resources conversion, and a percent of total field. An example of a pie section label is:
950/45 27%This example indicates that the effort is 950 days, 45 full-time resources are required, and this effort is 27 percent of the total pie. This label does not appear on the bar chart view.
Use the Demand Analysis page (RS_DMD_ACE_PAGE ) to analyze demand forecast data by supply categories by month.
Navigation:
Click the Demand Analysis link on the Demand Forecast Summary page.
This example illustrates the fields and controls on the Demand Analysis page.

This page behaves similarly to the Supply Analysis page, except that you analyze the data by using these categories:
Total Effort
Full Time Resources
Application Area
Application
Program
Release
See the product documentation forPeopleTools: Analytic Calculation Engine
Use the Demand Forecast - Demand Details page (RS_DMD_ROLE) to view details by role and other demand data, and add new demand to the forecast.
Navigation:
Click a link in the Demand column on the Demand Forecast Details page.
Click the Add New Demand button on the Demand Forecast Details page.
This example illustrates the fields and controls on the Demand Forecast - Demand Details page. You can find definitions for the fields and controls later on this page.
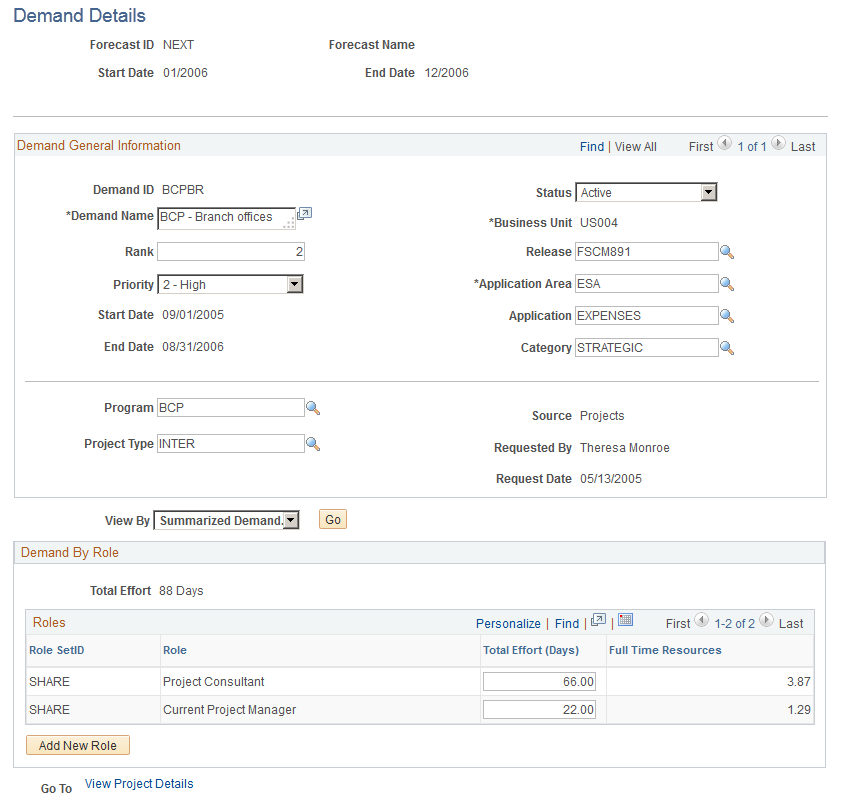
Enter demand detail information in the Demand General Information group box.
Field or Control |
Description |
|---|---|
Add New Role |
Click to access the Demand Forecast - Add New Role page and enter SetID and role information to add to the Demand By Role group box. |
OK |
Click to return to the Demand Forecast Details page with the updated information in the Demand group box. |
This action inserts a row into the Demand Detail table for the specified demand. Demand you enter here is automatically split evenly into the months in the start and end date range that you specified in the demand details.
Use the Demand Forecast - Add New Role page (RS_ADD_NEWROLE_DMD) to for the demand, add, modify, or delete roles, and change the level of effort needed for each role.
Navigation:
Click the Add New Role button on the Demand Forecast - Demand Details page.
This example illustrates the fields and controls on the Demand Forecast - Add New Role page.

Enter SetID, role, and effort for the demand.
Note: The unit of measure for Effort is either in days or hours based on the installation options.