Analyzing Commitment Control Using PeopleSoft Insights
This topic displays and explains how to analyze Commitment Control data using PeopleSoft Insights dashboards.
Use these pages to analyze Commitment Control using PeopleSoft Insights dashboards.
|
Page Name |
Definition Name |
Usage |
|---|---|---|
|
To analyze insights into authorized budgets and expenses tracked by Commitment Control |
||
|
View a summary of commitment control exceptions based on the Budget Checking (FS_BP) process. |
Use the Commitment Control Insights tile to analyze insights into authorized budgets and expenses tracked by Commitment Control. The dashboard provides the budget activity overview for one or more budget periods from the level of a ledger group selected for a business unit.
Navigation:
This tile can be placed on any PeopleSoft Fluid Home page. For additional information about how to add a tile to a PeopleSoft Fluid Home page, see PeopleTools: Application User’s Guide, “Working With PeopleSoft Fluid User Interface”, Working With Fluid Homepages, Managing Tiles, Adding Tiles to a Fluid Homepage.
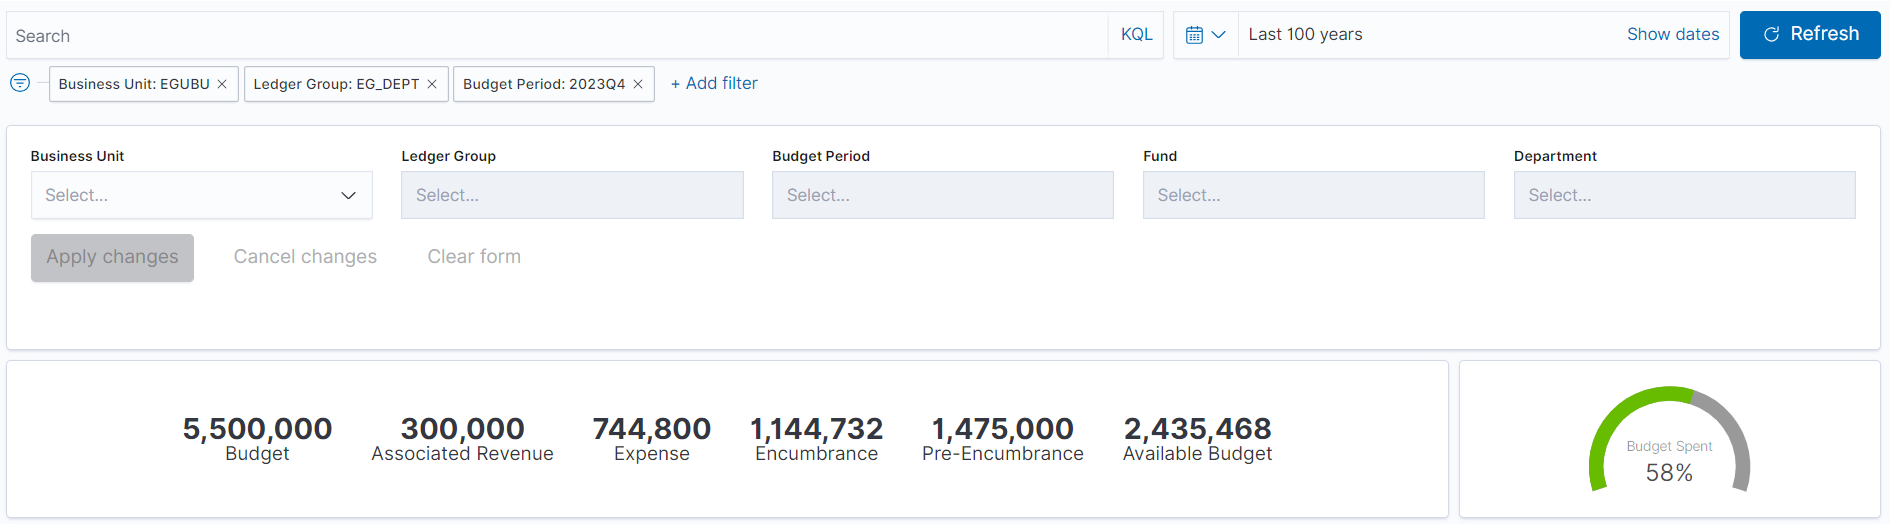
This example illustrates the fields and controls on the Commitment Control Insights dashboard (1 of 3)
This example illustrates the fields and controls on the Commitment Control Insights dashboard (2 of 3)

This example illustrates the fields and controls on the Commitment Control Insights dashboard (3 of 3)

The dashboard provides a summarized view of ledger balances with the ability to drill down to detail budget and source transaction lines for an expense ledger group.
|
Field or Control |
Description |
|---|---|
|
Budget |
Displays the total budgeted amount. |
|
Associated Revenue |
Displays the total amount of revenue from associated revenue budgets available for spending. |
|
Expense |
Displays the total amount of expenses, or expenditures, for the given budget. |
|
Encumbrance |
Displays the amount that you have a legal obligation to spend in the future. |
|
Pre-Encumbrance |
Displays the amount that you expect to spend, but which you have no legal obligation to spend. |
The Budget Overview visualization displays the Total Budget and Activity. Total Budget is the sum of Budget and Associated Revenue. Activity is the sum of different ledgers of an expense ledger group.
The Budget Entry Types visualization provides a view of different entry types of a budget which is Original, Adjustment, Transfer Original, Transfer Adjustment, Closing, and Roll Forward.
The Top Spend Departments visualization displays the top departments by budget spent.
The Top Spend Expenses visualization displays the budget activity and available budget for the accounts where the budget is spent.
The Exceptions table displays the warnings associated with each transaction and the occurrence count.
The Details grid displays the transaction source, document id and transaction line details.
Use the Commitment Control Exceptions dashboard to view a summary of commitment control exceptions based on the Budget Checking (FS_BP) process.
Navigation:
Commitment Control Exceptions tile can be placed on any PeopleSoft Fluid Home page. For additional information about how to add a tile to a PeopleSoft Fluid Home page, see PeopleTools: Application User’s Guide, “Working With PeopleSoft Fluid User Interface”, Working With Fluid Homepages, Managing Tiles, Adding Tiles to a Fluid Homepage.
This example illustrates the fields and controls on the Commitment Control Exceptions Insights dashboard (1 of 3)

This example illustrates the fields and controls on the Commitment Control Exceptions Insights dashboard (2 of 3)

This example illustrates the fields and controls on the Commitment Control Exceptions Insights dashboard (3 of 3)

The visualizations and data displayed on the Commitment Control Exceptions dashboard can be refined based on the delivered filters, such as Business Unit and Ledger Group. Multiple filter values can be selected. For example, you can select multiple business units from the Business Unit filter.
Data can also be filtered by selecting any categorical data within a visualization (for example, an individual bar in a bar graph). In addition, you can search for available filters or add additional filters.
The following visualizations are part of this dashboard:
Transactions with Budget Exceptions: Provides a count of transactions by source type that have budget exceptions for the selected time range. This visualization provides insight on the exceptions creation trend.
Transactions: Provides a count of total transactions.
Exceptions: Provides a count of total exceptions. Each transaction can have multiple exceptions.
Errors (guage): Provides a count of total errors. This information is represented in a gauge metric. The errors are color coded in different grades of red for 0-25, 25-50 and above 50 range.
Warnings (guage): Provides a count of total warnings. This information is represented in a gauge metric. Warnings are always displayed in green.
Errors (bar chart): Provides a count of errors by exception type in bar graph format.
Errors Exception Type: Provides additional details of error exception type.
Warning (bar chart): Provides a count of warnings by exception type in bar graph format
Warnings Exception Type: Provides additional details of warning exception type.
Errors by Source Transaction: Provides a count of errors by source transaction type.
Warnings by Source Transaction: Provides a count of warnings by source transaction type.
Item Detail: Displays a list of transactions making up the data shown in the visualizations. Use the Review Exceptions link to access the Budget Journal Exceptions Page and view further details about the exception.
Each visualization can be viewed separately in full screen. You can also drill down for more information using the Inspect option. That data can be downloaded as a CSV file.