Working with Cash Forecasting Presentation and Results
|
Page Name |
Definition Name |
Usage |
|---|---|---|
|
CSH_FCST_RESULTS |
Assess and optimize enterprise cash flow. |
|
|
CSH_FCST_SAVE_SP |
Add or modify cash forecast search criteria. |
|
|
USER_PREFERENCES |
Set up the default search and other position functions, funds transfer settings, and charting options for the Cash Forecast Results. |
|
|
Cash Sweep Request Page |
CSH_SWEEP_REQ |
Schedule the Cash Sweep Calculations process. See Processing Cash Sweep and Reviewing the Results and the Cash Sweep Request Page. |
|
CSH_FCST_SHOCK_RES |
Copy a worksheet and modify cash flow amounts. |
Many options are available when you generate and display cash forecast results. For example, you can:
View your position over a period of time or evaluate it for just one day.
Analyze cash forecast trends and distributions using graphic representations.
Perform a variety of actions, including transfer funds and execute cash sweeps.
Access worksheet line item details and drill down to source transactions.
Base your cash forecast on a previous worksheet, adjusting the amounts by specified factors to estimate future cash positions.
Calculate variance and display visual cues in the results.
The Cash Forecasting Results page when populated with data shows three main areas: a results grid, saved searches, and visual representations. The initial results page will be blank, and populated upon executing a search. Results displayed depend on the specified search criteria as well as cash forecasting user preferences.
Results Grid
Cash Forecast Results grid displays cash forecast data corresponding to each worksheet line item and dimension. Rows in the results grid display worksheet line items, which may be associated with one or more position sources. The columns are dynamic and can represent any supported dimension, such as bank, bank account, currency, business unit, and several more that you configure during setup.
Depending on setup, the cash manager can analyze the cash forecast results and perform the following actions:
Transfer funds.
Execute cash sweeps.
Access worksheet line item details.
Drill down to source transactions.
You can also configure variance thresholds on the worksheet definition to calculate variance and display visual cues on the Cash Forecast Results grid for each worksheet line item. You can specify three variance thresholds: normal, warning, and alert.
Saved Searches
Saved searches retrieve data from cash forecasting computations and display cash forecast results in your preferred dimensions. Saved searches offer views that are delivered with the system and shared across users. The relative date option in the search criteria enables users to define searches once, and execute daily. Saved Searches are created by saving the search criteria with a search name.
You can create and save searches to view cash positions for these dimensions:
Each bank.
Each bank account.
A group of bank accounts.
Cash sweep structures.
Each business unit.
A group of business units.
User-defined dimensions.
Each source set.
Variance between source sets.
Time periods, such as daily, weekly, monthly, and so on.
Up to three position currencies.
You can also view transaction currency exposure.
Charts and Graphs
The cash forecasting pie chart shows the cash forecast data calculated for each worksheet line item for a value date.
A trend analysis chart displays the cash flow for each dimension over time. Users can control the days to trend and the number of top dimensions to trend through User Preferences. The trend analysis graph helps create a clearer picture of historical patterns that can be used to anticipate cash flow needs.
Use the Cash Forecasting Results page (CSH_FCST_RESULTS) to assess and optimize enterprise cash flow.
Navigation:
This example illustrates the fields and controls on the Cash Forecasting Results page. You can find definitions for the fields and controls later on this page.
Field or Control |
Description |
|---|---|
Actions |
Choose from these actions:
|
Saved Searches |
Choose from saved searches to populate the results grid and graphic presentation. |
locked and unlocked icons |
Indicates whether amounts are locked or unlocked. If cash flow details are locked, you cannot override the amount when you drill down to details. Also the value does not change if the cash forecast is recalculated for the same calculation date. You can set the Cash Forecast User Preferences to use the lock reminder. Locks are displayed only when viewing results by source set and time set. Also the position currency on the results page should match the default position currency specified on the Worksheet Definition page to display the locks. Oracle’s PeopleSoft recommends locking the results on a daily basis. |
Amount links |
Click an amount link to drill down to line item details. |
Related Action (on Total Amount column) |
Use the Related Action options on Total Amount column to transfer funds. |
View Results by Bank
Populate the SetID, Worksheet ID, Amount, Position Source Set, Date Type, Shift by Days/Value Date, and Position Currency fields.
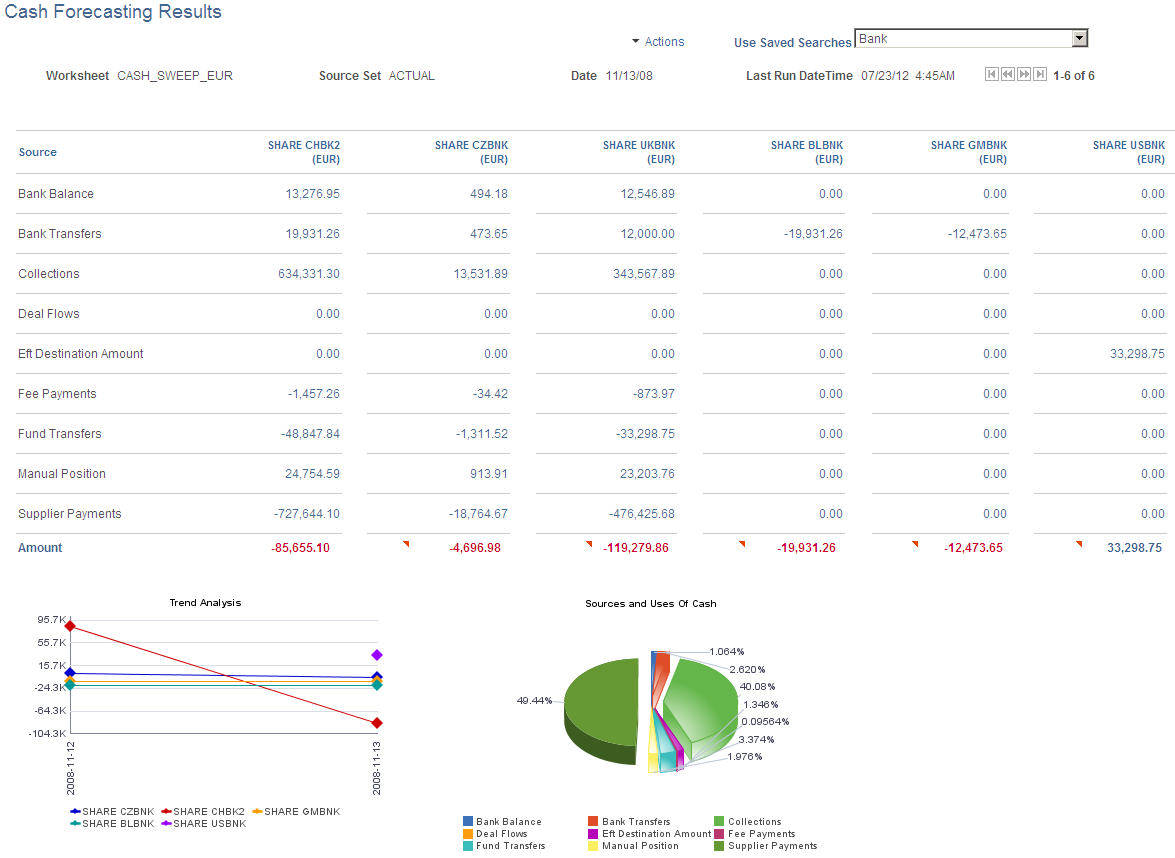
To view cash position needs for each bank, define a search by populating the View Results by field with Bank. You can further filter to view the results for a specific Bank SetID or Bank SetID and Bank Code.
On the results grid, each column shows data designated to a bank.
This example illustrates the fields and controls on the Cash Forecasting Results page - results displayed by bank.
View Results by Bank Account
Populate the SetID, Worksheet ID, Amount, Position Source Set, Date Type, Shift by Days/Value Date, and Position Currency fields.
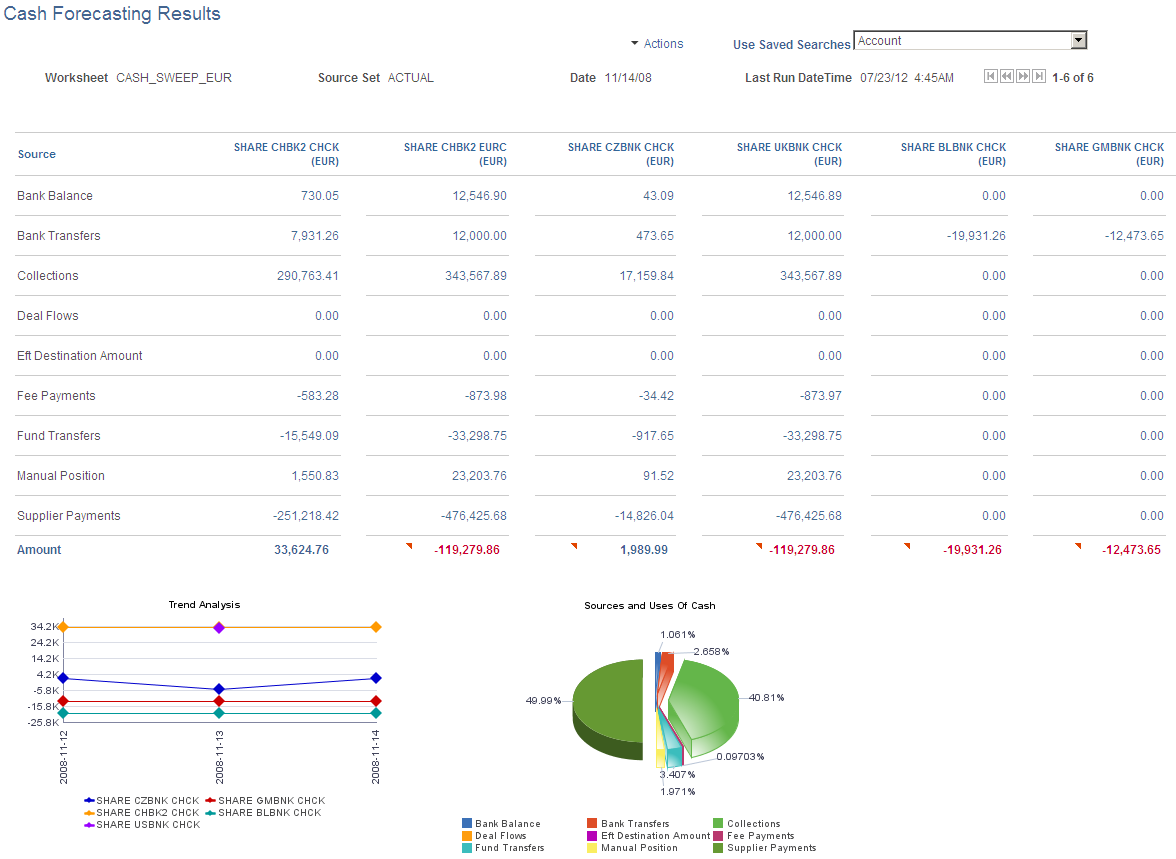
To view cash position needs for each bank account, define a search by populating the View Results by field with Bank Account. You can further filter to view the results for a specific Bank SetID; Bank SetID and Bank Code; or Bank SetID, Bank Code, and Bank Account.
On the results grid, each column shows data designated to a bank account.
When you populate the View Results by field with Bank Account, you choose either Position Currency or Bank Account Default Currency in the Bank Account Currency field. These selections display results measured in the currency you defined.
This example shows results by bank account:
This example illustrates the fields and controls on the Cash Forecasting Results page - results displayed by bank account.
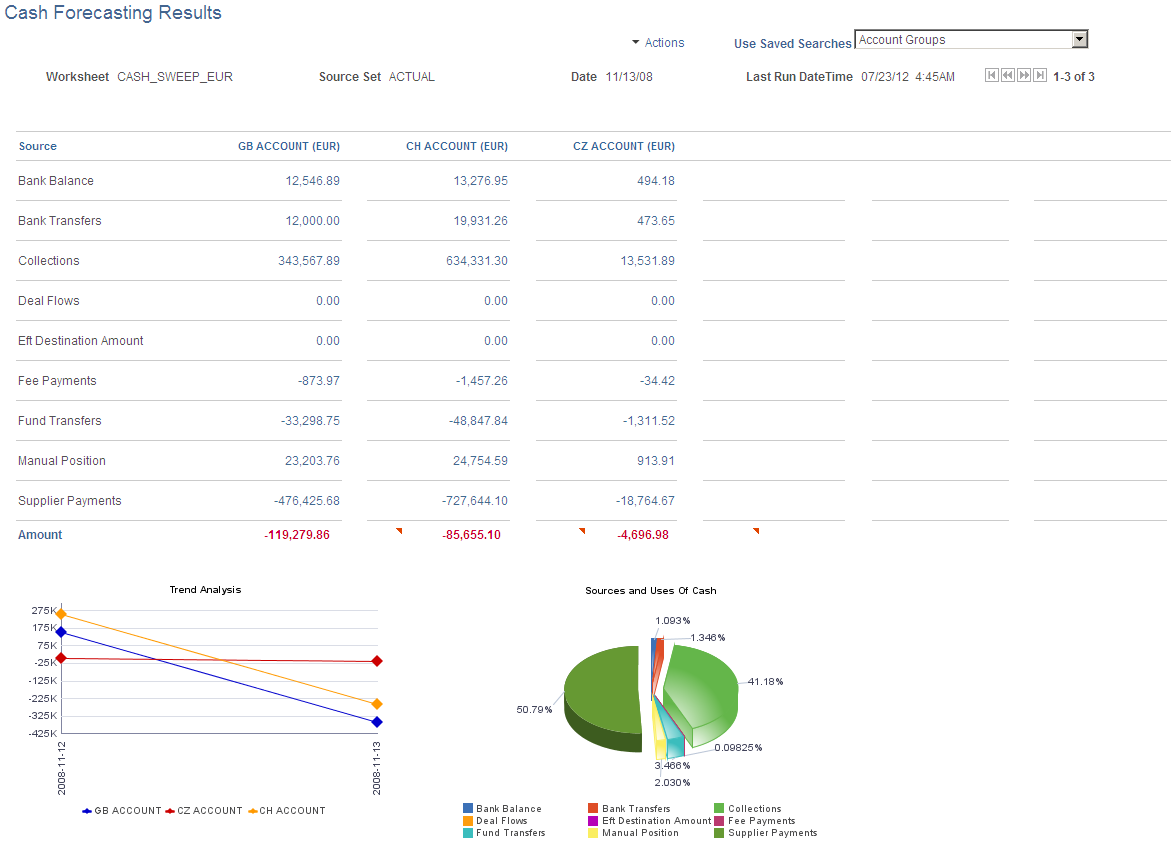
When you view results by Bank Account you have two more options for viewing results: In the Bank Criteria group box, choose to view the results by Account Groups or by Cash Sweep Structure. If you select Display By Account Groups, then each column shows an Account Group. The system summarizes position data for all bank accounts associated with that Account Group and displays the results in the grid.
This example shows results by account groups:
This example illustrates the fields and controls on the Cash Forecasting Results page - results displayed by account group.
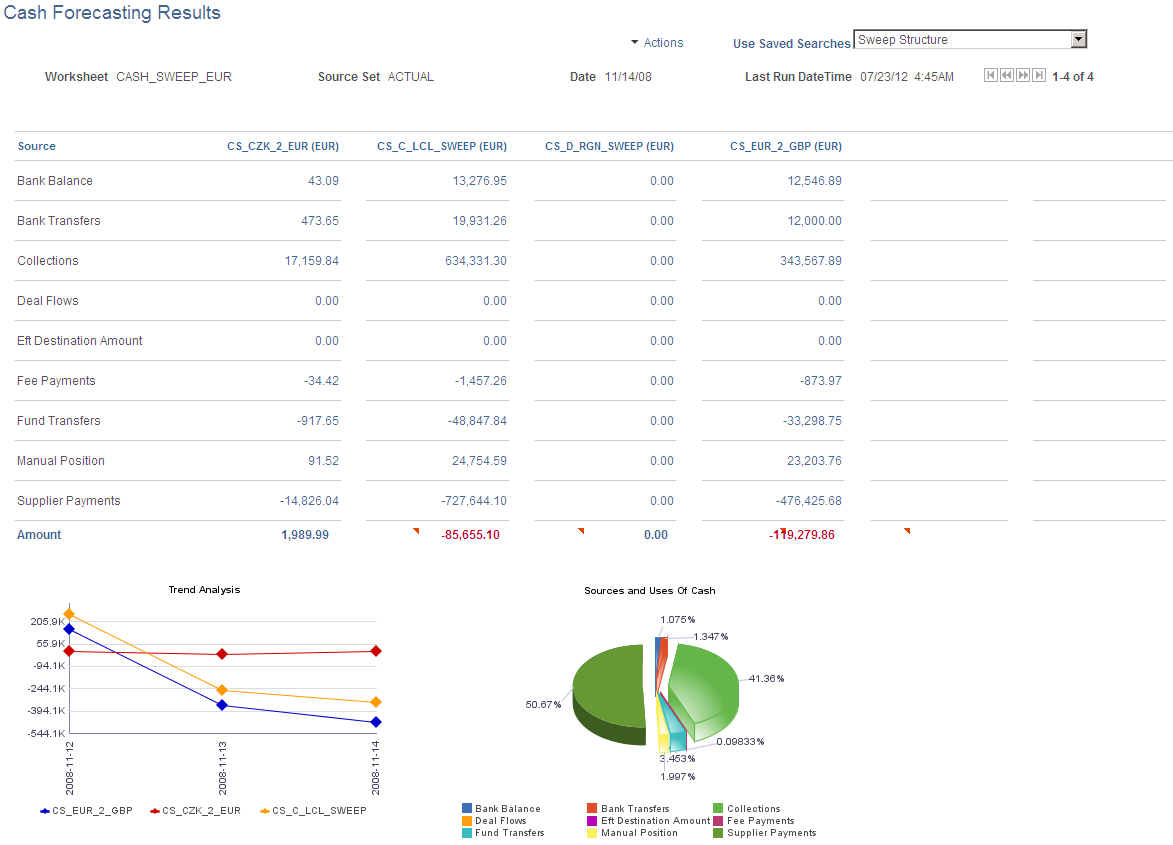
When you choose to display by cash sweep, then each column displays a Cash Sweep Structure. The system summarizes position data for all bank accounts associated with the selected Cash Sweep Structure and displays the results in the grid.
This example shows results by cash sweep structure:
This example illustrates the fields and controls on the Cash Forecasting Results page - results displayed by cash sweep structure.
View Results by Business Unit
Populate the SetID, Worksheet ID, Amount, Position Source Set, Date Type, Shift by Days/Value Date, and Position Currency fields.
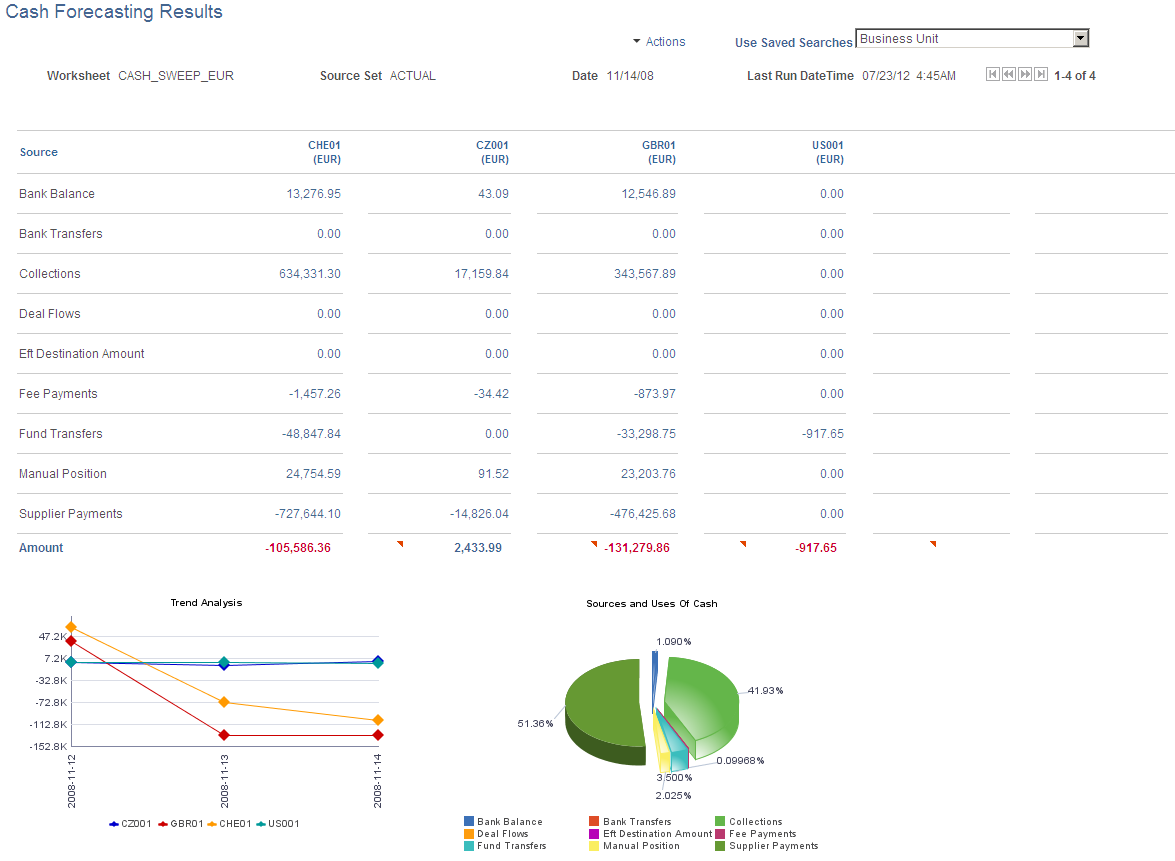
To view cash position needs for each business unit, define a search by populating the View Results by field with Business Unit. You can further filter to view the results for a specific Business Unit or a Business Unit Group. In the results grid, each column shows data designated to a Business Unit.
This example shows results by business unit:
This example illustrates the fields and controls on the Cash Forecasting Results page - results displayed by business unit.
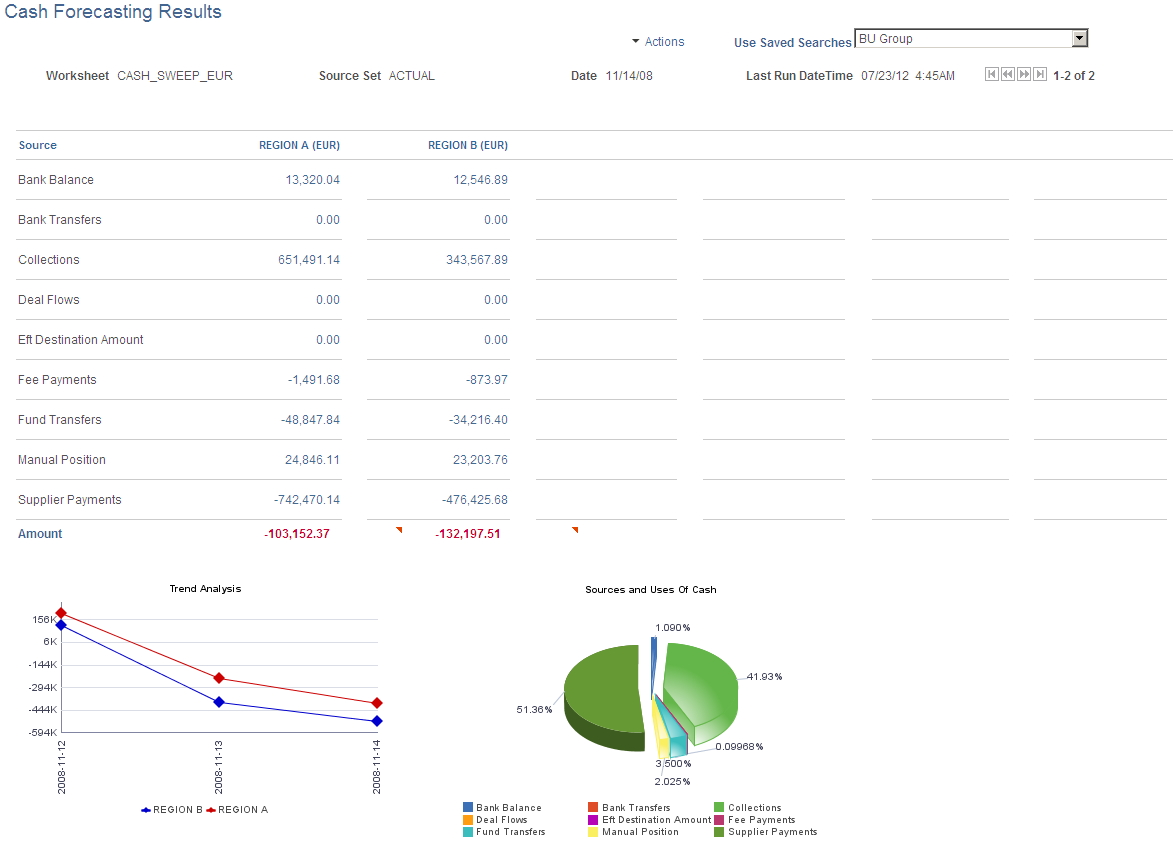
When you view results by Business Unit, you can also opt to display the results by a business unit group. The system summarizes position data for all business units associated with each Business Unit Group and displays the results in the grid, where the columns show data for each Business Unit Group.
This example shows results by business unit group:
This example illustrates the fields and controls on the Cash Forecasting Results page - results displayed by business unit group.
View Results by User Configurable Dimension
Populate the SetID, Worksheet ID, Amount, Position Source Set, Date Type, Shift by Days/Value Date, and Position Currency fields.
To view cash position needs for a user-configured dimension, define a search by populating the View Results by field with a Group By Field value. In the results grid, each column shows data designated to a user-configured Group By Field value.
View Results by Position Currency
Populate the SetID, Worksheet ID, Amount, Position Source Set, Date Type, and Shift by Days/Value Date fields.
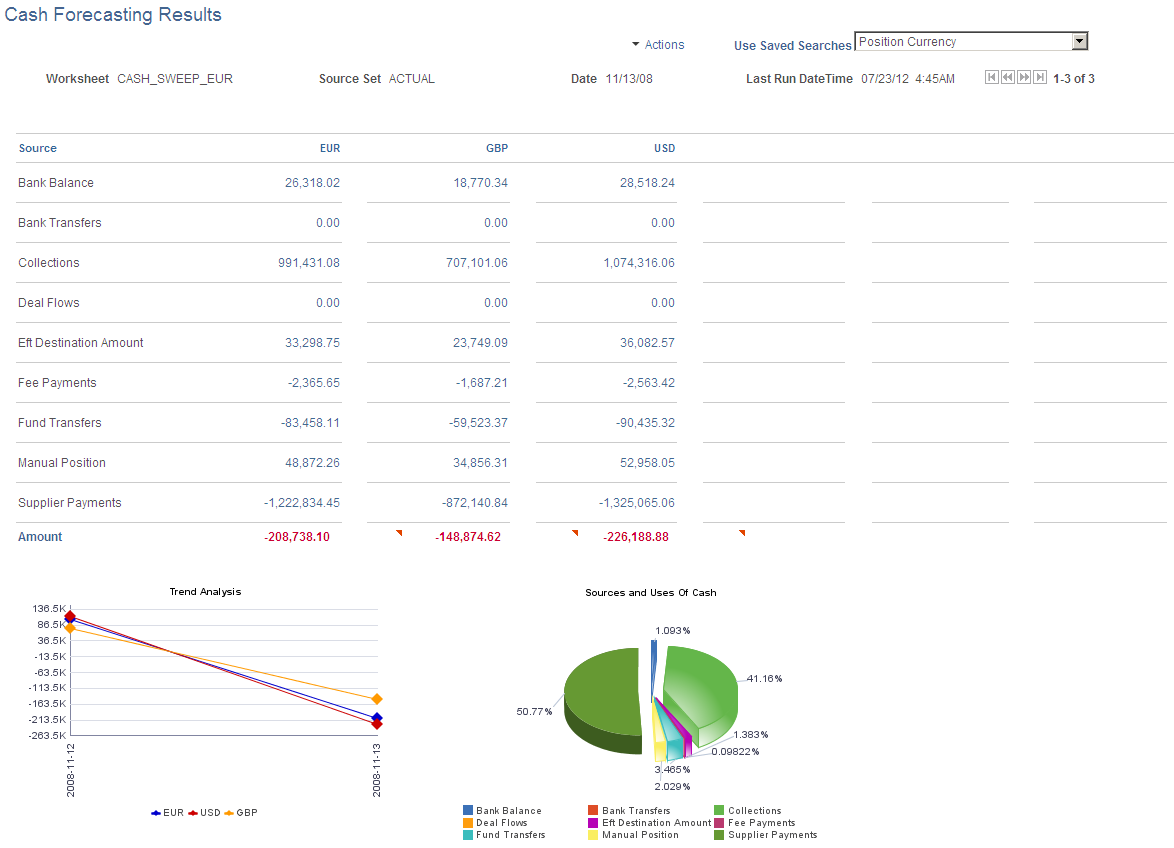
To view cash position needs for each position currency, define a search by populating the View Results by field with Position Currency. In the results grid, each column shows data designated to a Position Currency.
The system generates only a trend analysis chart when viewing results by Position Currency.
This example shows results by position currency:
This example illustrates the fields and controls on the Cash Forecasting Results page - results displayed by position currency.
View Results by Source Set
Populate the SetID, Worksheet ID, Amount, Date Type, Shift by Days/Value Date, and Position Currency fields.
To view cash position needs for each source set, define a search by populating the View Results by field with Source Set. In the results grid, each column shows data designated to a Source Set.
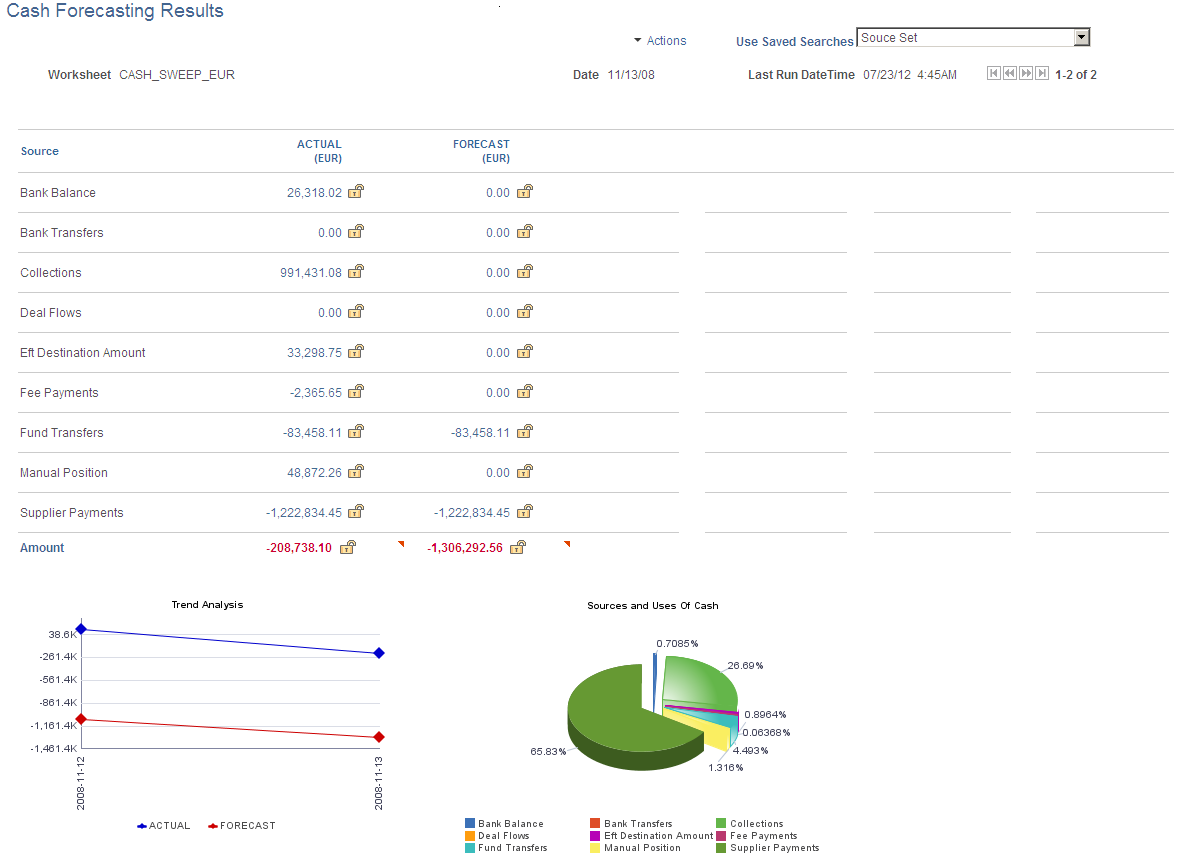
This example shows results by source set:
This example illustrates the fields and controls on the Cash Forecasting Results page - results displayed by source set.
When you view results by Source Set, you can also opt to display the variance between two source sets, in the Variance Description field. This option requires that you first define multiple source sets and identify variance between the source sets on the Worksheet Definition. The system calculates the amount and percentage variance for each worksheet line item and shows a visual cue for each variance, based on the Variance Alert Percents defined in the Worksheet Definition.
Use this results option to view intraday cash position, actual versus projected forecast data, or both.
This example shows results by source sets for which variance alerts have been configured:
This example illustrates the fields and controls on the Cash Forecasting Results page - results displayed with variance alerts.
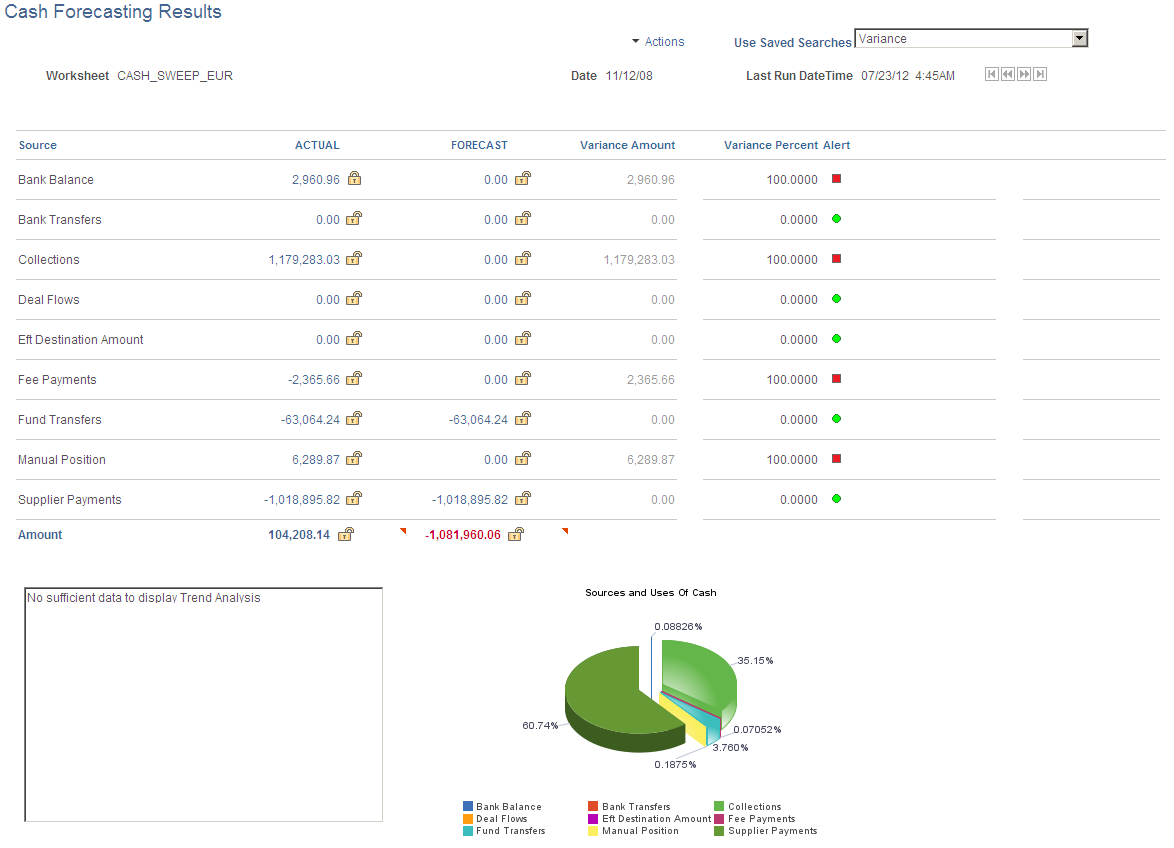
The variance amount and percentage are calculated as follows:
See also Worksheet Definition Page.
View Results by Time Set
Populate the SetID, Worksheet ID, Amount, Position Source Set, and Position Currency fields.
To view cash position needs for each time set, or period, define a search by populating the View Results by field with Time Set. You must also identify a Time Set in the Time Set Criteria group box. In the results grid, each column shows data designated to a time period.
When you specify a time set, the system uses the time period from the associated Time Set. You can specify a start date as well.
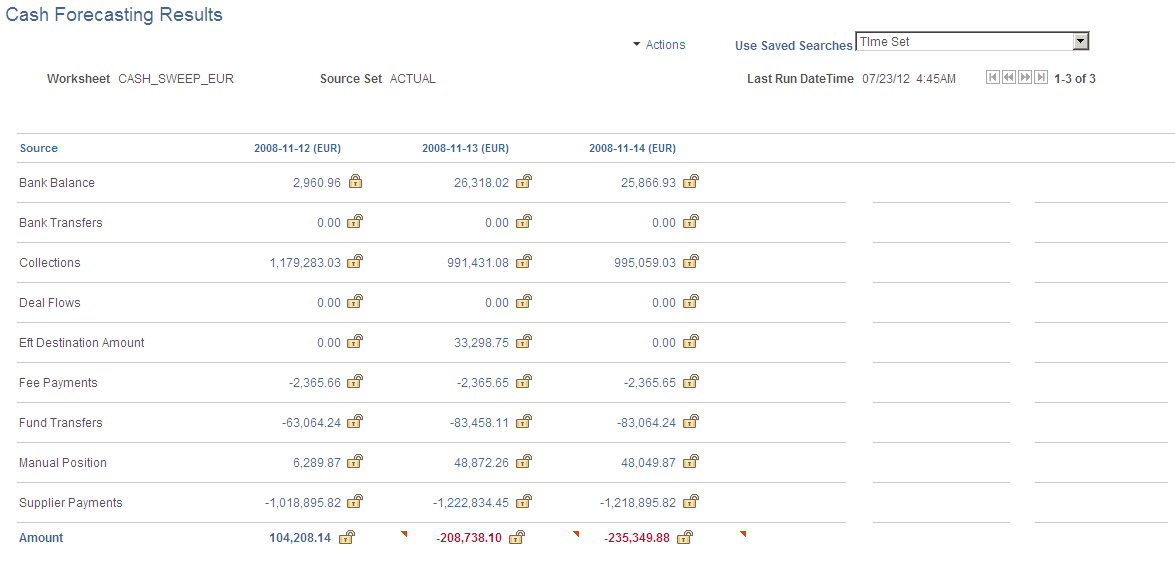
Use this results option to view periodic forecasts. This example shows results for a three-day time segment:
This example illustrates the fields and controls on the Cash Forecasting Results page - results displayed by time set.
View Results by Transaction Currency
Populate the SetID, Worksheet ID, Amount, Position Source Set, Date Type, and Shift by Days/Value Date fields.
To view cash position needs for each transaction currency, define a search by populating the View Results by field with Transaction Currency. In the results grid, each column shows data designated to a Transaction Currency.
The system generates only a trend analysis chart when viewing results by Transaction Currency.
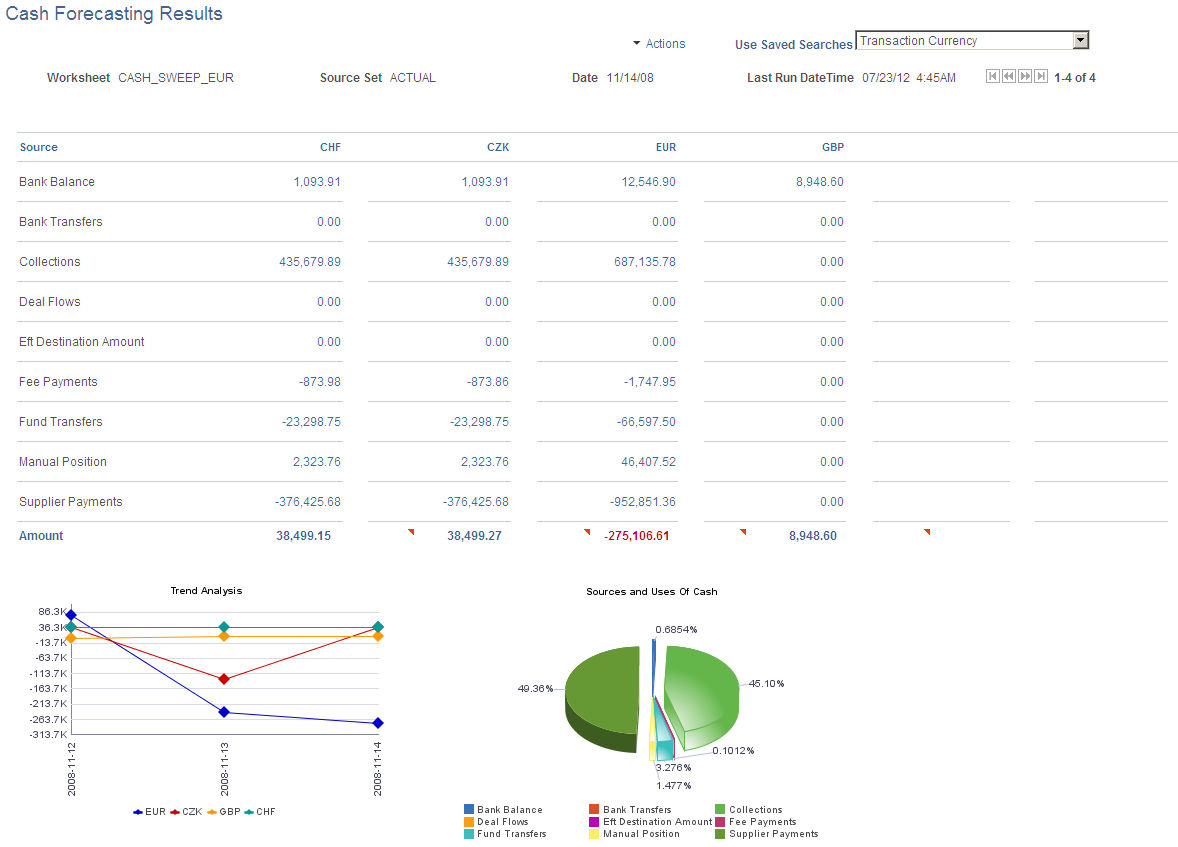
Use this results option to view currency exposure. This example shows results by transaction currency:
This example illustrates the fields and controls on the Cash Forecasting Results page - results displayed by transaction currency.
The criteria you specify on the Cash Forecast Search can be used one time or reused multiple times. If you intend to use the search criteria multiple times, specify a search name after you have defined the search criteria and click OK on the Cash Forecast Search page. The system saves the search name and makes the search available for selection in the Use Saved Searches list.
Note: You can view results on the Cash Forecast Results page only if you have scheduled the Cash Forecast process and results are available in Cash Forecast Results tables.
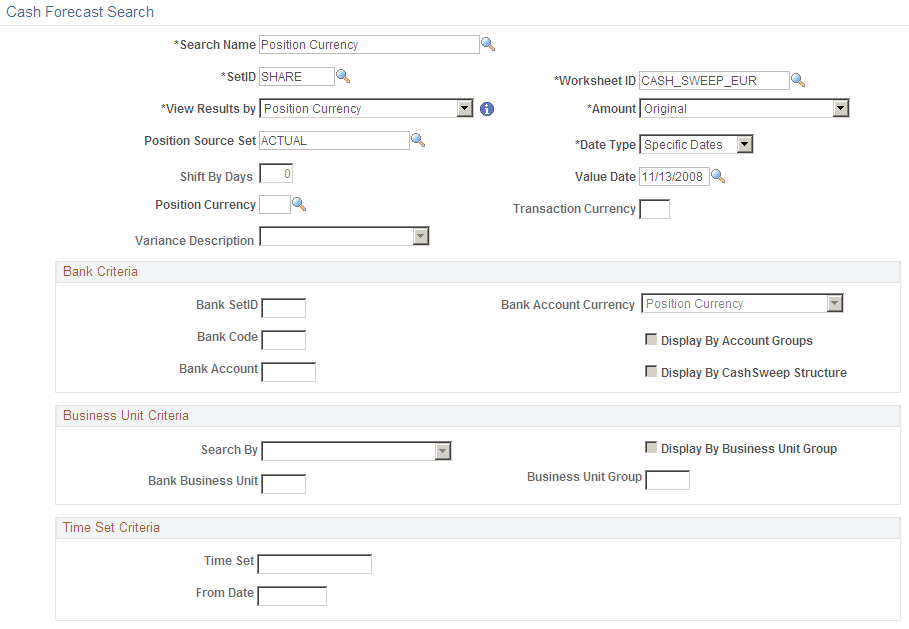
Use the Cash Forecast Search page (CSH_FCST_SAVE_SP) to add or modify search criteria.
Navigation:
Click the Add New Search link or the Update Search link in the Actions list on the Cash Forecasting Results page.
This example illustrates the fields and controls on the Cash Forecast Search page. You can find definitions for the fields and controls later on this page.
Field or Control |
Description |
|---|---|
Search Name |
Enter a new name for these search criteria, or use the lookup prompt to select an existing search, to review or edit the search parameters. |
SetID |
Enter a SetID associated with the Worksheet ID. |
View Results by |
Select from these options. Depending on your selection, other search parameters on the page will be enabled.
|
Worksheet ID |
Enter the ID for the worksheet that you set up on the Worksheet Definition page. |
Amount |
Choose from Original or Weighted. |
Position Source Set |
Select the source set for which you want to see cash forecast results. |
Date Type |
Choose from Relative Dates or Specific Dates. |
Value Date |
Enter a Value Date for which Cash Forecast Results have been calculated. The Value Date field is available if the Date Type is Specific Dates. |
Shift By Days |
Enter a number of days to determine the value date for which results need to be displayed. This field is available when you select the Relative Dates date type option. The system calculates the value date by using the Shift By Days value to adjust the system date. A Shift By Days value of zero (0) specifies the system date. |
Position Currency |
Select a position currency that is associated with the Worksheet Definition. |
Transaction Currency |
Enter a value if you want to see the results for a specific transaction currency. This field is available when you elect to view results by Transaction Currency. You can filter the results for a specific currency. |
Variance Description |
Enter a description of the variance. Variance represents a comparison of results between two source sets and is set up on the Worksheet Definition. |
Bank Criteria
These fields are active when you view results by Bank.
Field or Control |
Description |
|---|---|
Bank SetID |
Enter a bank SetID. |
Bank Code |
Enter a bank code. |
Bank Account |
Enter a bank account. |
Bank Account Currency |
Choose from Bank Account Default Currency or Position Currency. |
Display By Account Groups |
Choose to display results by Account Groups. |
Display By Cash Sweep Structure |
Choose to display results by Cash Sweep Structure. |
Business Unit Criteria
These fields are active when you view results by Business Unit.
Field or Control |
Description |
|---|---|
Search By |
Choose a business unit search option from the list:
|
Bank Business Unit |
Enter a bank business unit. |
Business Unit Group |
Enter a business unit group to display results for each business unit within that group. |
Display By Business Unit Group |
Select to display cash forecast results by business unit group rather than by business unit. |
Time Set Criteria
These fields are active when you view results by Time Set.
Field or Control |
Description |
|---|---|
Time Set |
Select a time set that you have defined on the Define Time Sets page. |
From Date |
Identify the start date for the period of time. |
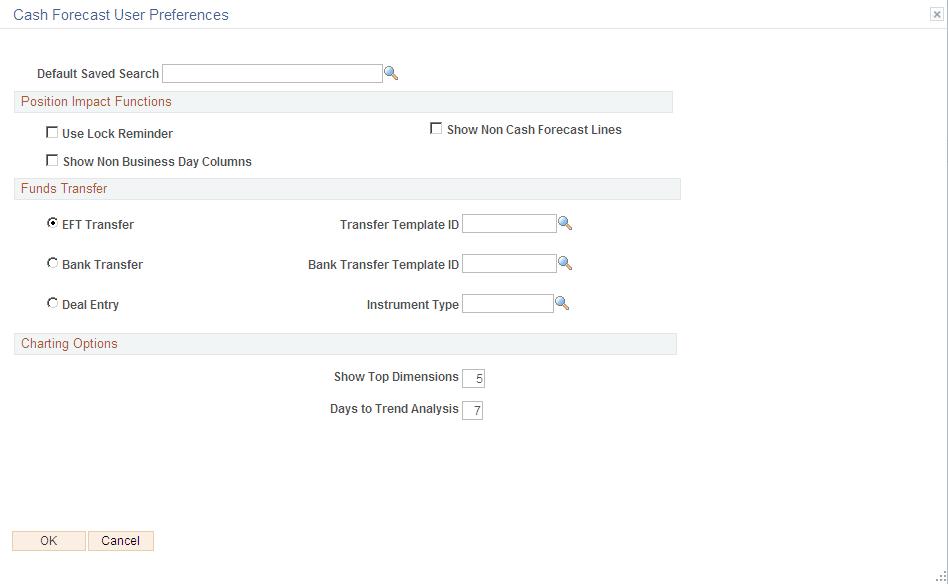
Use the Cash Forecast User Preferences page (USER_PREFERENCES) to set up the default search and other position functions, funds transfer settings, and charting options for the Cash Forecast Results.
This example illustrates the fields and controls on the Cash Forecast User Preferences page. You can find definitions for the fields and controls later on this page.
Field or Control |
Description |
|---|---|
Default Saved Search |
Select an existing saved search to use as the default when accessing the Cash Forecasting Results page. When a default search has not been specified, the initial results page contains no data. |
Position Impact Functions
Field or Control |
Description |
|---|---|
Use Lock Reminder |
Select to see lock reminders when viewing results by Source Set or Time Set. |
Show Non Business Day Columns |
Select to show a column for every day of the week. |
Show Non Cash Forecast Lines |
Select to display non-cash flow details, if defined in the Non-Cash Flow Details grid on the Worksheet Line Items page. |
Funds Transfer
Choose the type of funds transfer and the corresponding transfer template ID, or the deal entry along with the instrument type, which will be the default transfer type when you initiate a transfer from the results grid. Select one pair of values:
EFT Transfer and Transfer Template ID
Bank Transfer and Bank Transfer Template ID
Deal Entry and Instrument Type
Charting Options
The charting options apply only to the trend chart.
Field or Control |
Description |
|---|---|
Show Top Dimensions |
Enter a number from 1 to 9 to show the top line dimensions. |
Days to Trend Analysis |
Enter a number from 1 to 99. The trend chart shows the specified number of days calculated back from the Value Date in the search criteria. |
You can schedule a cash sweep from the Cash Forecast Results page or through the Cash Sweep component.
For more information about cash sweep and requesting a cash sweep in the Cash Sweep component, see Processing Cash Sweep and Reviewing the Results.
Use the Cash Sweep Request page (CSH_SWEEP_REQ) to schedule the Cash Sweep Calculations process.
Navigation:
Click the Execute Cash Sweep link in the Actions list on the Cash Forecasting Results page.
This example illustrates the fields and controls on the Cash Sweep Request page.
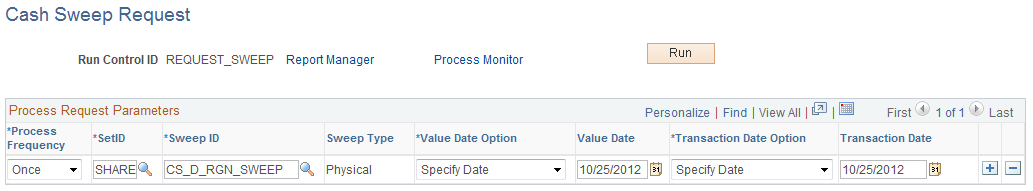
The Cash Sweep Request page displays Sweep IDs associated with the Worksheet Definition. Select the Sweep IDs for which you want to schedule the Cash Sweep Request and click OK. The system schedules the Cash Sweep Request in the background.
Note: If you want to see the updated forecast results after executing a cash sweep, you must also run the Cash Forecast Calculations Application Engine (TR_CSH_FCST) process.
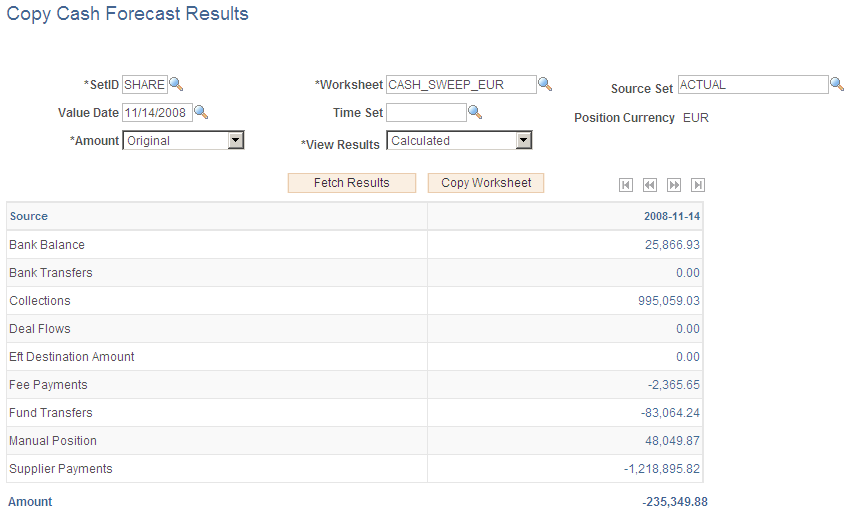
Copy Cash Forecast Results functionality allows a user to shift dates and amounts for calculated cash forecast results and analyze the impact of these shifts on Cash Forecast Amount. When shifting dates and amounts, you can apply offsets on an ad hoc basis or use predefined scenarios. The copied results are stored separately from the calculated results based on history.
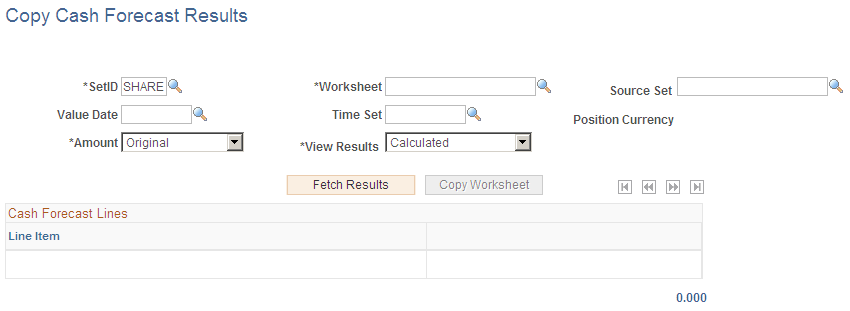
Use the Copy Cash Forecast Results page (CSH_FCST_SHOCK_RES) to copy a worksheet and modify cash flow amounts.
Navigation:
This example illustrates the fields and controls on the Copy Cash Forecast Results page . You can find definitions for the fields and controls later on this page.
Field or Control |
Description |
|---|---|
SetID |
Enter a SetID. |
Worksheet |
Enter the ID for the worksheet that you set up on the Worksheet Definition page. |
Source Set |
Select a source set that is associated with the worksheet on the Worksheet Definition page. |
Value Date |
Enter a date if you wish to work with one date. |
Time Set |
Select a time set, if you wish to work with multiple dates. This option is not supported when you want to see both calculated and copied results together by selecting Calculated and Copied in the View Results field. |
Position Currency |
Displays the default reporting currency that was defined on the Worksheet Definition page. |
Amount |
Choose from Original or Weighted. |
View Results |
Choose from these options:
|
Fetch Results |
Click this button to populate fields in the Cash Forecast Lines grid with results that match parameters specified in the search fields. |
Copy Worksheet |
Click this button to copy the worksheet and modify the cash flow amounts. |
To copy cash forecast results:
Enter search parameters in the Copy Cash Forecast Results page header fields to return calculated data.
Click the Fetch Results button to populate the Cash Forecast Lines grid.
This example illustrates the fields and controls on the Copy Cash Forecast Results page with fetched results. Retrieved results are ready to be copied:
Click the Copy Worksheet button to access the Forecast Details – Worksheet Offset page.
Specify the Worksheet Offset criteria as desired to shift the dates and amounts.
You can apply the offsets to shift individual rows or all rows.
Note: The system supports only positive integers and zero (0) for offset days.
This example illustrates the fields and controls on the Forecast Details - Worksheet Offset page, with an example of offset details.
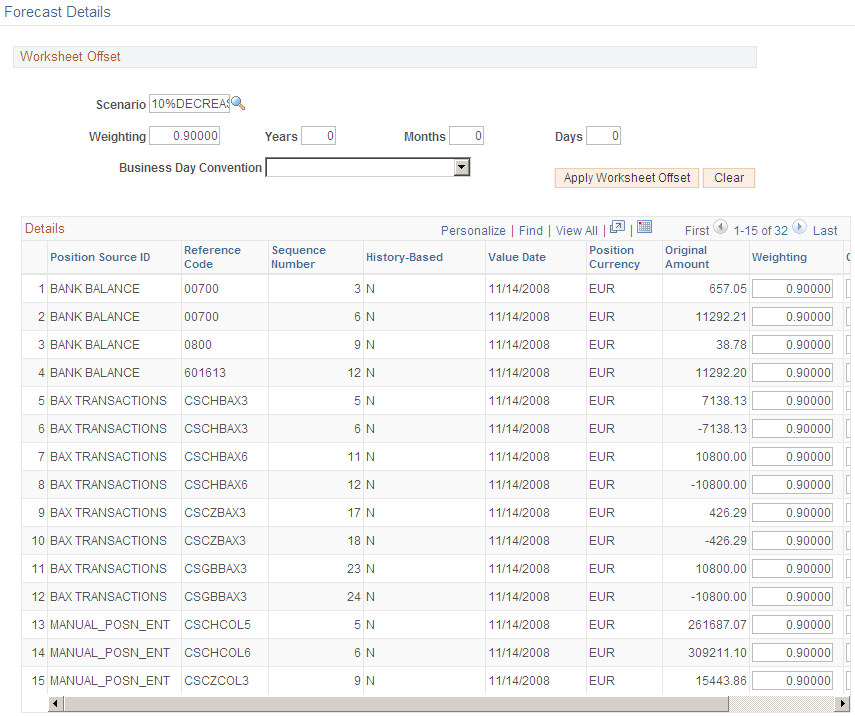
Click the Apply Worksheet Offset button and OK to save the copied results and return to the Copy Cash Forecast Results page.
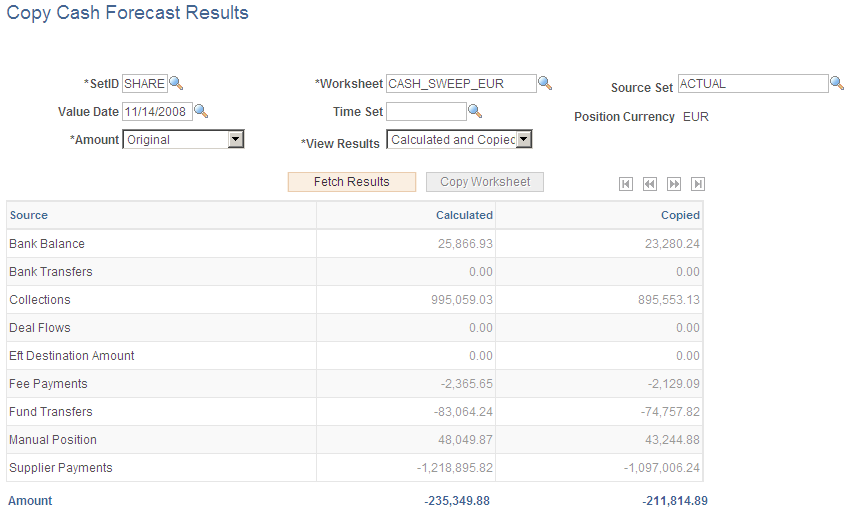
To view calculated and copied results together, select Calculated and Copied in the View Results field, and click the Fetch Results button.
The results show the Calculated and Copied columns, with values for each line item.
This example illustrates the fields and controls on the Copy Cash Forecast Results page with calculated and copied results.