Analyzing VaR
This topic provides an overview of VaR analysis and discusses how to run VaR analysis.
|
Page Name |
Definition Name |
Usage |
|---|---|---|
|
RSK_VAR_RUN_PNL |
Enter analytical parameters and calculate VaR on your portfolios. |
VaR is a methodology for measuring financial risk exposure. VaR is a number that represents estimated portfolio losses due to market movements for a particular time period and a given confidence level. With VaR, you can identify sources of risk and either bear them to support long-term strategies, transfer the risks at a reasonable price, or decide on alternatives to shed the risk.
Defining potential loss depends on two parameters:
Time horizon considerations.
Degree of confidence.
Time Horizon Considerations
Choosing a horizon for VaR calculation depends on your company's objectives and the portfolio's characteristics. Typical considerations include:
Unwind period: how long, on average, does it take to reverse a market position or individual trade?
Attention period: how often, on average, do you reexamine your portfolio and its mark-to-market or hedging trades?
Accounting period: how long until the next financial reporting must be done?
Degree of Confidence (Probability of Occurrence)
The degree of confidence is a measure of the degree of certainty of the VaR estimate. The most commonly used degree of confidence is 95 percent, which means that 95 percent of the time the losses will be lower than the VaR number, while 5 percent of the time the portfolio will experience greater losses.
For example, an enterprise's Relative Earnings at Risk (EaR) are 10.00 MM USD, the time period is set to three months, and the confidence level is 95 percent. Over the next three months, there is a five percent chance that earnings will fall 10.00 MM USD or more below the target earnings for the period (6.00 MM USD).
Note: VaR concentrates on financial price risk, not on operational, legal, and other risks that the enterprise faces.
Calculating VaR
You can calculate VaR from three complementary methodologies and use these different measurements to simultaneously provide an overall view of your portfolio's risks.
Term |
Definition |
|---|---|
Variance-covariance (analytic VaR) |
The most commonly used of the three VaR methods, variance-covariance analyzes volatility and correlation between different risk exposures of an enterprise's portfolio. |
Monte Carlo simulation |
Generates random scenarios of prices and uses them to reevaluate a portfolio. Looking at hypothetical profits and losses under each price scenario, you can construct a histogram of expected profit and losses from which VaR is calculated. It does not assume that portfolio returns are distributed normally, but you need a correlation and volatility matrix to generate the random scenarios. |
Historical simulation |
Revalues a portfolio for several hundred historical scenarios, building a "hypothetical" distribution of profit and losses based on how the portfolio behaved in the past. It does not use estimated variances and covariances and does not make any assumptions about the distribution of the portfolio returns. Results can be skewed by anomalous events of a previous period. A few major events in the past may dominate the simulation exercise, so your analysis is then based on fewer data points. |
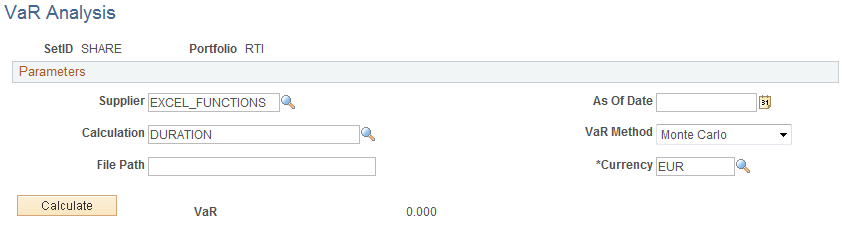
Use the VaR Analysis page (RSK_VAR_RUN_PNL) to enter analytical parameters and calculate VaR on your portfolios.
Navigation:
This example illustrates the fields and controls on the VaR Analysis page. You can find definitions for the fields and controls later on this page.
Field or Control |
Description |
|---|---|
Vendor |
Select a third-party supplier that will perform the VaR calculation based on the input values selected on this page. The supplier selected here determines the values available in the Calculation field. |
Calculation |
Select the type of VaR calculation to be performed. The calculation value selected here determines which functions from the MTM_DATAMAP_WRK.FUNLIB_02 function library are used to call the supplier to perform the calculation |
File Path |
Specify the output location of the log file for this supplier. |
VaR Method |
Select from the following options:
|
Calculate |
Click to run the VaR calculation. |
VaR |
Displays the results of the specified VaR calculation. |