Performing Inventory Substitute Analytics
Inventory Substitute Analytics help organizations to analyze out-of-stock inventory situations and other fulfillment issues. Using the report, organizations can identify the substitute items that are being used in significant quantities, monitor the performance of fulfillment metrics due to partial item substitutions, and identify cost implications of substitute items.
|
Page Name |
Definition Name |
Usage |
|---|---|---|
|
Inventory Substitute Analytics Page |
IN_SUBSTITUTION_FL |
To view the list of substitute items and create item substitution analytics report. |
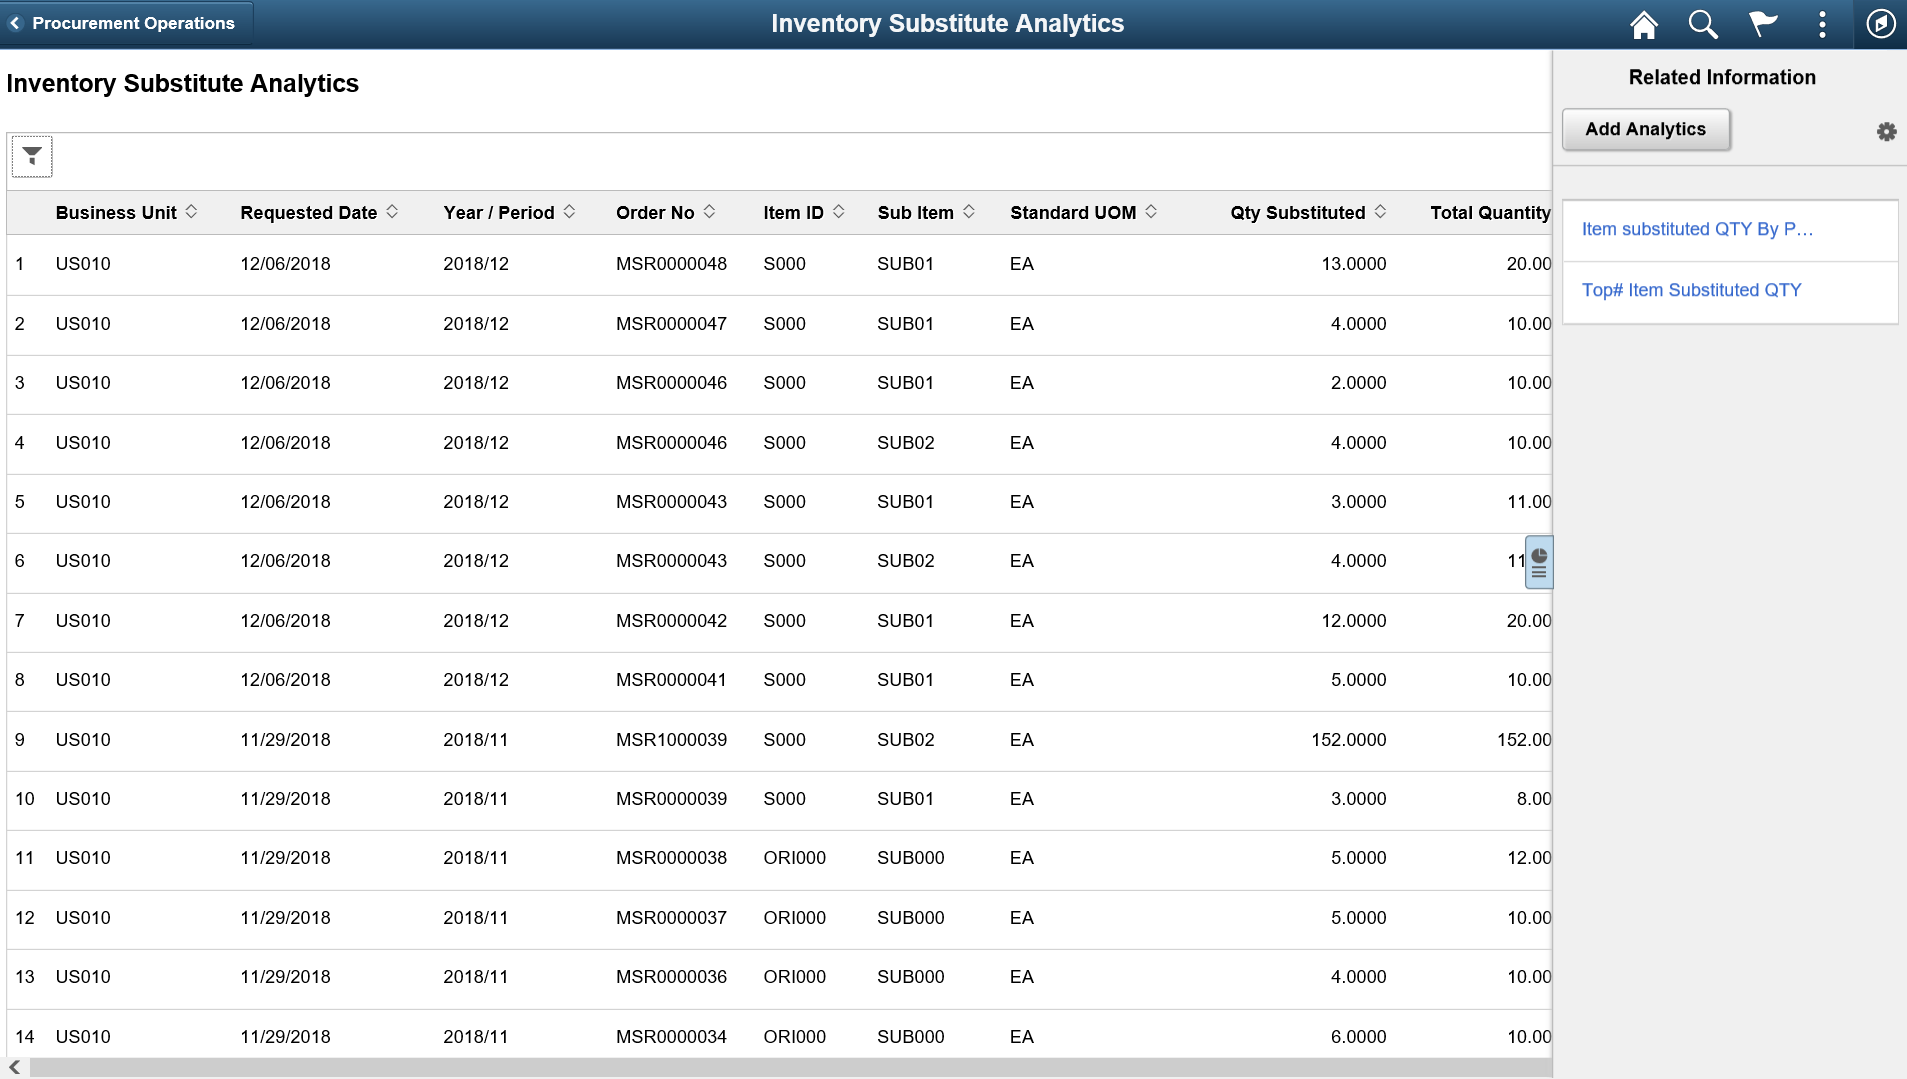
Use the Inventory Substitute Analytics page (IN_SUBSTITUTION_FL) to view the list of substitute items and create item substitution analytics report.
Navigation:
You can also select the Item Substitute Analytics tile from the Procurement Operations home page.
This example illustrates the fields and controls on the Inventory Substitute Analytics page. You can find definitions for the fields and controls later on this page.
Field or Control |
Description |
|---|---|
Filter |
Provide the required criteria in the Refine Filter Criteria window to filter the list. The Reset button in the Refine Filter Criteria window clears all values except the default filter values. Note: You can also define the default filter criteria on the Configure Filter Values page. The Filter ID specified should be IN_SUBITEM. |
|
Click to expand or collapse the Related Information pane. This pane displays the saved analytics reports. |
Add Analytics |
Select to create analytics reports as per your requirements. |
Personalize Related information |
Select this icon and choose the display options for the created reports. |

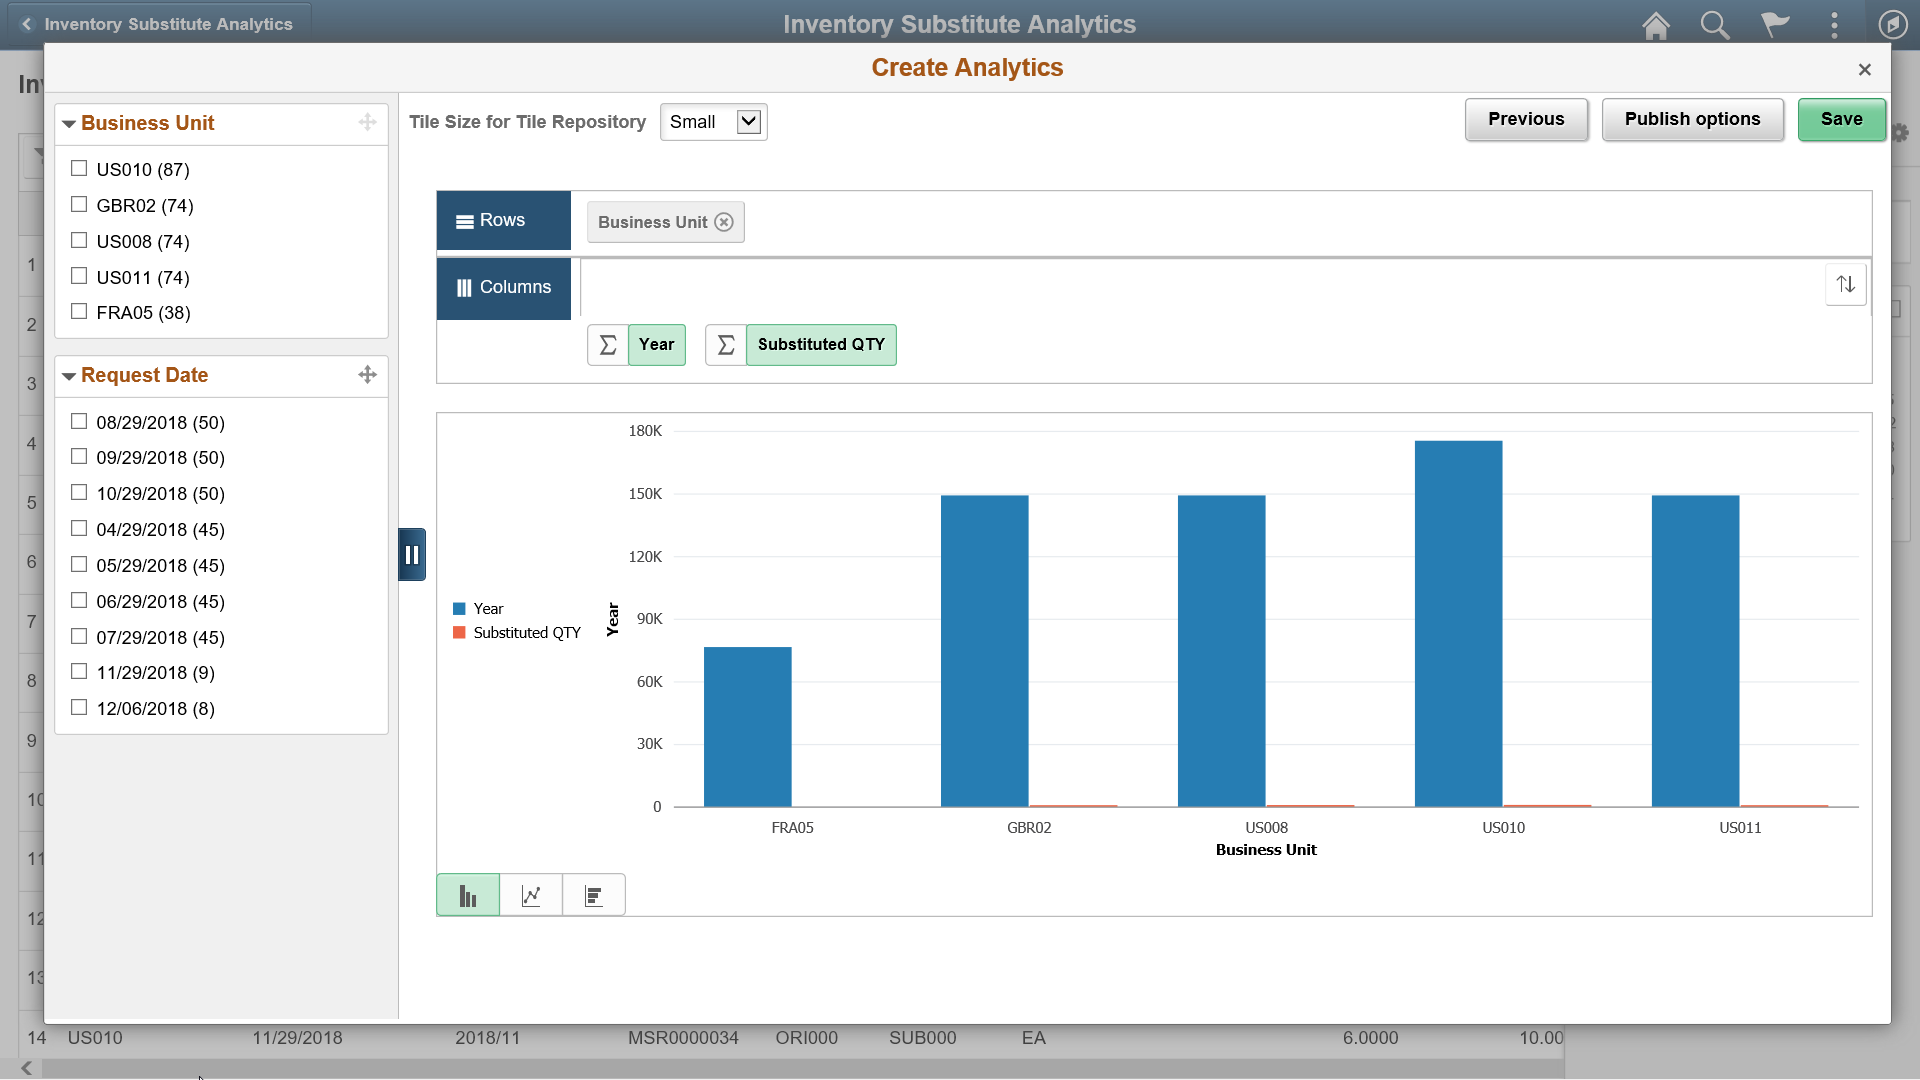
The Simplified Analytics framework allows you to create and design the reports as per your requirements.
For example, you can create a report that shows the substitute items for a particular period, a report of the top 10 substituted items and their quantities over a user-defined period of time, or a cost comparison report of requested item and substitute items.
To create a substitute analytics report, you need to enter the name of the report and select the analytics type from the drop down. Types of reports include:
Inventory Item Substitution (Pivot Grid: IN_ITEMSUB_RPT): Shows the original item, substitute item, and substituted quantity.
Item Substitution Rate (Pivot Grid: IN_ITEMSUB_RATE): Shows the substituted item quantity, total requested quantity, and the average rate.
By default, the Create Analytics page shows the dates set on the Pivot Grid Wizard page. You can set new default date values on the Pivot Grid Wizard page. If required, you can modify the From Date and To Date on the Create Analytics page. After entering the required details, select Next.
This example illustrates the fields and controls on the Inventory Item Substitution Report. You can find definitions for the fields and controls later on this page.
Field or Control |
Description |
|---|---|
Publish options |
Select to publish the created report. |
Save |
Select to display the report in the Related information section. |
For additional information on Simplified Analytics, see PeopleTools: Pivot Grid