Understanding the Supply/Demand Dashboard
This topic provides overviews about:
Business purpose.
Supply/Demand charts.
Accessing the Supply/Demand Dashboard for the first time.
The purpose of the Supply/Demand Dashboard is to identify and focus on bottlenecks in the fulfillment business process. It provides visibility into potential fulfillment problems before they become customer issues. Supply and demand managers can identify potential problems, take alternate action, and resolve the problem before it becomes an issue.
The Supply/Demand Dashboard can be added as a link in the Supply/Demand WorkCenter, or it can be accessed from the Inventory menu option.
Users can configure the Supply/Demand Dashboard for personal preferences by User ID such as identifying templates used when displaying charts, information, business unit, currency, and so on.
The Supply / Demand Dashboard displays four quadrants that can display up to four charts. A manager accesses the S/D Dashboard and sees up-to-the minute details of potential issues being tracked. For example, if an inventory manager is managing two warehouses, he can view available quantities in each warehouse (two charts) and current demand broken into time-phased buckets, which are based on scheduled ship dates. In addition, he can view incoming supply for each warehouse (two charts), in time-phased buckets. This enables the inventory manager to view supply and demand for two warehouses and make decisions on how to manage a potential issue.
If potential issues are found, inventory managers can use the mass change feature to adjust supply and demand. The mass change feature is a secure option and users must be given access to this feature. If access is not provided for this feature, a user will not see mass change options.
Delivered Charts
PeopleSoft delivers six charts to choose from:
INV - Inventory Demand
INV - Par Location MSRs
MFG – Component Demand (manufacturing – component demand)
MFG – Production Supply (manufacturing – production supply)
PO – Expected Receipts (purchasing – expected receipts)
PO – PAR Location Orders (purchasing – par location orders)
For more information about the delivered charts, see Multiple Chart Search Page.
The Supply/Demand Dashboard is delivered empty. Therefore you will have to create Supply/Demand Dashboard templates and determine which templates are to be displayed the next time you access the menu option.
This example illustrates the Supply/Demand Dashboard when you initially access the menu option:
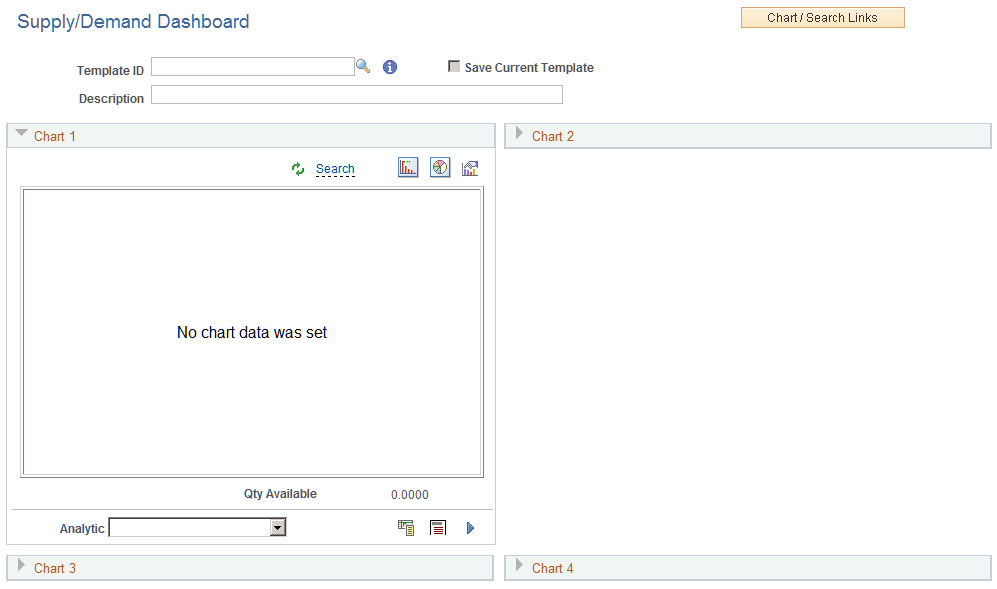
For additional information about how to populate the Supply/Demand Dashboard with charts, See Creating Templates for the Supply/Demand Dashboard.