Analyzing Payment Spend with the PeopleSoft Fluid User Interface
|
Page Name |
Definition Name |
Usage |
|---|---|---|
|
PTPG_NUI_VWR |
Track and analyze paid and expensed spend amounts. |
Use the Payment Spend Analysis page (PTPG_NUI_VWR) to track and analyze paid and expensed spend amounts.
Navigation:
This example illustrates the fields and controls on the Payments Spend Analysis page.
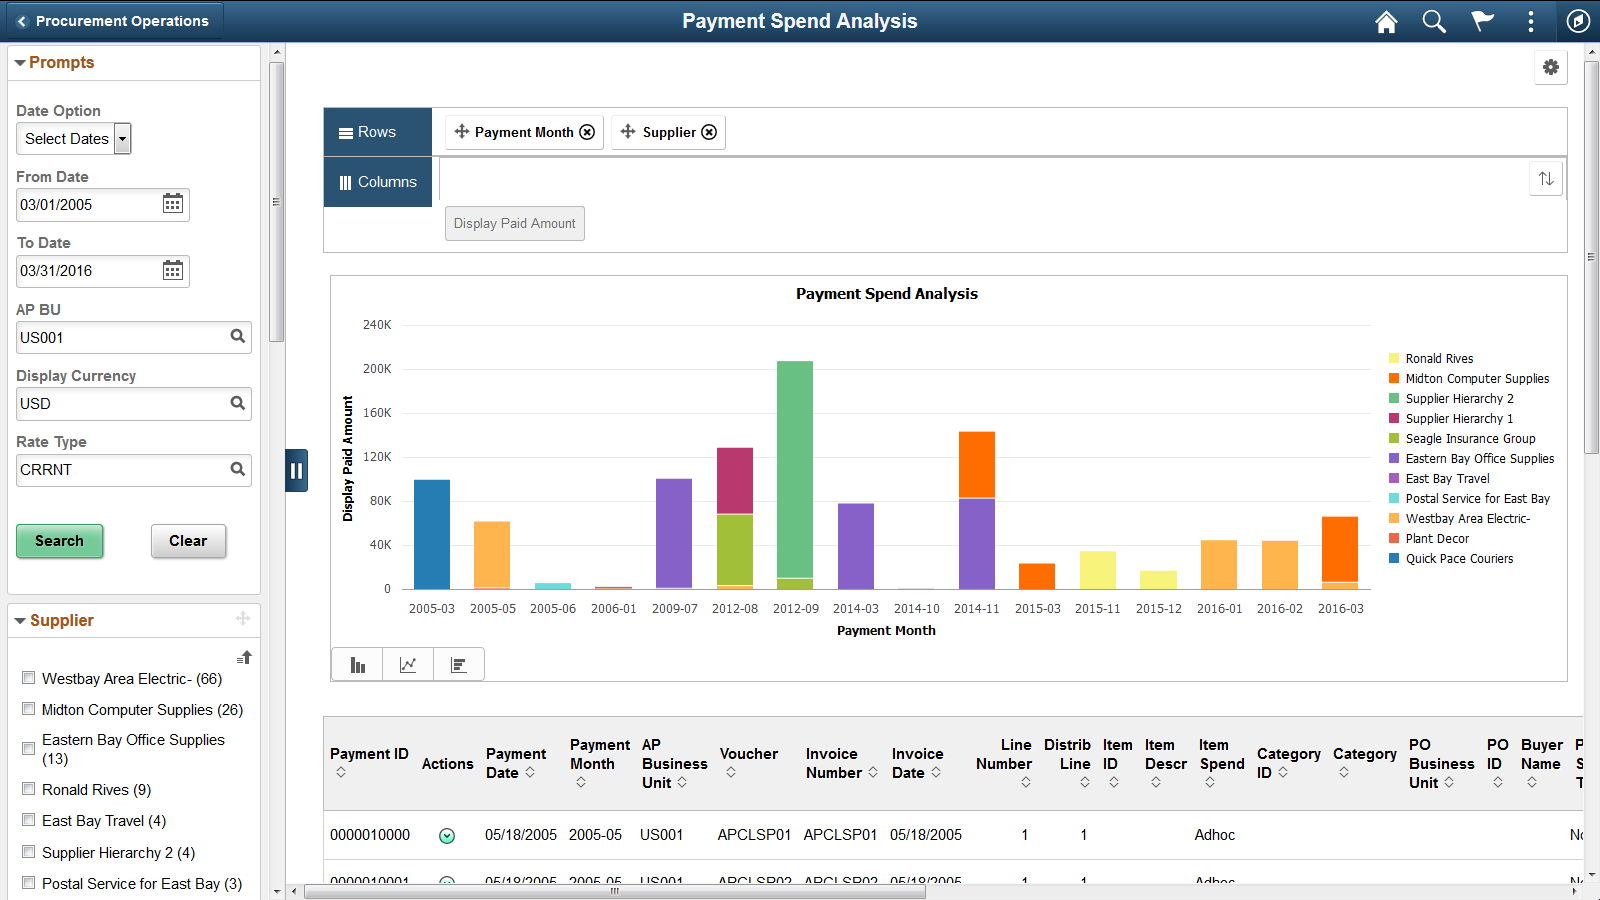
Use the pivot grid to track and analyze paid and expensed spend amounts. The pivot grid enables you to display data in different views by performing operations such as pivoting and filtering. This enables you to interpret data in a variety of ways. Pivots grids are based on PS Queries and can display results in a grid format, a chart format, or both.
You can choose the type of graph you want to use to display your data—including bar, line, and pie charts. Click the bars in a graph (or pie slice) in the pivot grid to view details or drill down by various dimensions.
Use the left panel to modify delivered prompts and filters. Users can select from a range of data using field prompts. You can analyze payments using various facets, such as supplier, business unit, purchase order spend versus non purchase order spend, and so forth.
The Payment Spend Analysis page includes these prompts and filters:
Date Option (30 days, 60 days, 90 days, or Select Dates)
From/To Date (payment date)
AP BU (Accounts Payable Business Unit)
Display Currency
Rate Type
Supplier
Payment Month
AP Business Unit (Accounts Payable Business Unit)
Item Spend
Category
PO Business Unit (Purchasing Business Unit)
Buyer Name
PO Spend Type (Purchase Order Spend Type)
Contract Spend Type
View Grid Option
Use View Grid under the Options Menu (cog icon) to modify the layout and analytics of the pivot grid and table by adding or removing prompts and facet values in the grid. The modal window also includes the facet pane on the left. When you click the Apply button in the top right of the modal, the chart is refreshed based on the current layout of the grid.
For more information about this option, see product documentation for PeopleTools: Pivot Grid.
Update Filters Option
Use Update Filters under the Options Menu (cog icon) to add or remove filters from the left panel of the Payment Spend Analysis page.
For more information about this option, see product documentation for PeopleTools: Pivot Grid.
Chart Options
Use Chart Options under the Options Menu (cog icon) to change chart labels, chart axis and layout, and so forth.
For more information about this option, see product documentation for PeopleTools: Pivot Grid.
Threshold Options
Use Threshold Options under the Options Menu (cog icon) to configure basic threshold settings for the Display Paid Amount column.
For more information about this option, see product documentation for PeopleTools: Pivot Grid.