Analyzing Purchasing Using PeopleSoft Insights
This topic displays and explains how to analyze Purchasing data using PeopleSoft Insights dashboards.
|
Page Name |
Definition Name |
Usage |
|---|---|---|
|
Provides insight into the contract trends within the selected time frame. |
||
|
Provides insight into the current trend of purchase volume, top suppliers, rejections and returns of purchase orders, and procurement volume. |
||
|
Provides insight into the purchase order trend based on different criteria such as, status, acknowledgement status, budget status, document tolerance status, and so on. |
||
|
Provides insight into the performance of suppliers based on the compliance to Service Level Agreement (SLA), quality, delivery performance, pricing, and POA responsiveness. |
Use the Procurement Contracts dashboard to view the contract trends within the selected time frame.
Navigation:
Select the Procurement Contracts tile.
This example illustrates the fields and controls on the Procurement Contracts Dashboard. You can find definitions for the fields and controls later on this page.

Field or Control |
Description |
|---|---|
|
Click to view a visualization in full-screen mode. You can see this icon when you hover over a visualization. |
|
Select to make changes to the current filter criteria. |
|
Click to select the required time period. The dashboards display data according to the date range specified. |


You can filter the data by entering a relevant search text in the Search field or by specifying additional filter criteria. You can also filter the data by clicking a segment or a bar. The filters modify the data across all visualizations. The data table below the visualizations displays the contract and purchase order details that match the specified filter criteria. You can download the data as a CSV file.
Visualizations that are part of this dashboard are:
Contracts by Contract Style — Shows the distribution of contracts by styles for the selected time frame.
Contracts by Status — Shows the distribution of contracts by their status for the selected time frame.
Contract Vs Non Contract Spend — Shows the Contract and Non Contract amount based on the purchase order data. A purchase order with a status of Cancelled or Open is excluded from this visualization.
Top Suppliers — Shows the top five suppliers in the descending order of the Non Contract spend.
Contracts Expiry by Month — Shows the number of contracts expiring in the next six months from the date the dashboard is accessed. Contracts expiry is counted irrespective of whether the contract is already renewed, and a new contract is created or not.
At the bottom of the dashboard, the data table lists the contracts details with corresponding purchase order information if available. If a purchase order was created without a contract, the Contract ID field appears blank. Click the View Details link to navigate to the Document Status page.
Use the Purchasing Effectiveness dashboard to analyze the current trend of purchase volume, top suppliers, purchase order volume, rejections and returns of purchase order by suppliers, and procurement volume.
Navigation:
Select the Purchasing Effectiveness tile.
This example illustrates the fields and controls on the Purchasing Effectiveness dashboard.

The dashboard helps managers to analyze the purchase orders and procurement volume in terms of different criteria.
You can apply different filters to modify the data across all visualizations. Hover over different sections in the visualization to see the statistics.
Visualizations that are part of this dashboard are:
Purchase Volume by Business Unit — Shows the purchase volume within the specified time frame for each business unit that the user has access to. Amounts, irrespective of the transaction currency, are converted to the reporting currency defined on the Purchasing Installation Options page.
Top Suppliers — Shows the top five suppliers by purchasing amount. The dashboard shows the suppliers based on the applied filters.
Purchase Order by Pay Terms — Shows the purchase order volume by payment.
Delivery Performance — Shows the number of shipments that are received on time, early, and late. If the item is received on the date mentioned as the due date in the purchase order, it is considered to be an on time delivery. If it is before and after the due date, then it is considered as Early and Late deliveries respectively.
Purchase Order Amount by Budget Status — Shows the purchase order amount grouped by various budget statuses. Purchase orders that do not require budget validations are excluded from this visualization.
Rejections and Supplier Returns — Shows the top five suppliers with the purchase volume that they rejected or returned. Rejections indicate the purchase order items that are rejected at the receipt level, thus reducing the Net received quantity of the receipt. Supplier returns indicate the purchase order items that are removed from the Net received quantity through Supplier Returns using RTV.
Procurement Volume Trend — Shows the purchase volume created over a specific time frame.
Below the visualizations, the Purchase Order and Receipt Details table lists the purchase orders and the corresponding receipt details. Click the View Details link to view the Document Status page for the selected purchase order.
Use the Purchasing Operations dashboard to view the purchase order trend based on criteria such as, status, acknowledgement status, budget status, document tolerance status, and so on.
Navigation:
Select the Purchasing Operations tile.
This example illustrates the fields and controls on the Purchasing Operations dashboard.
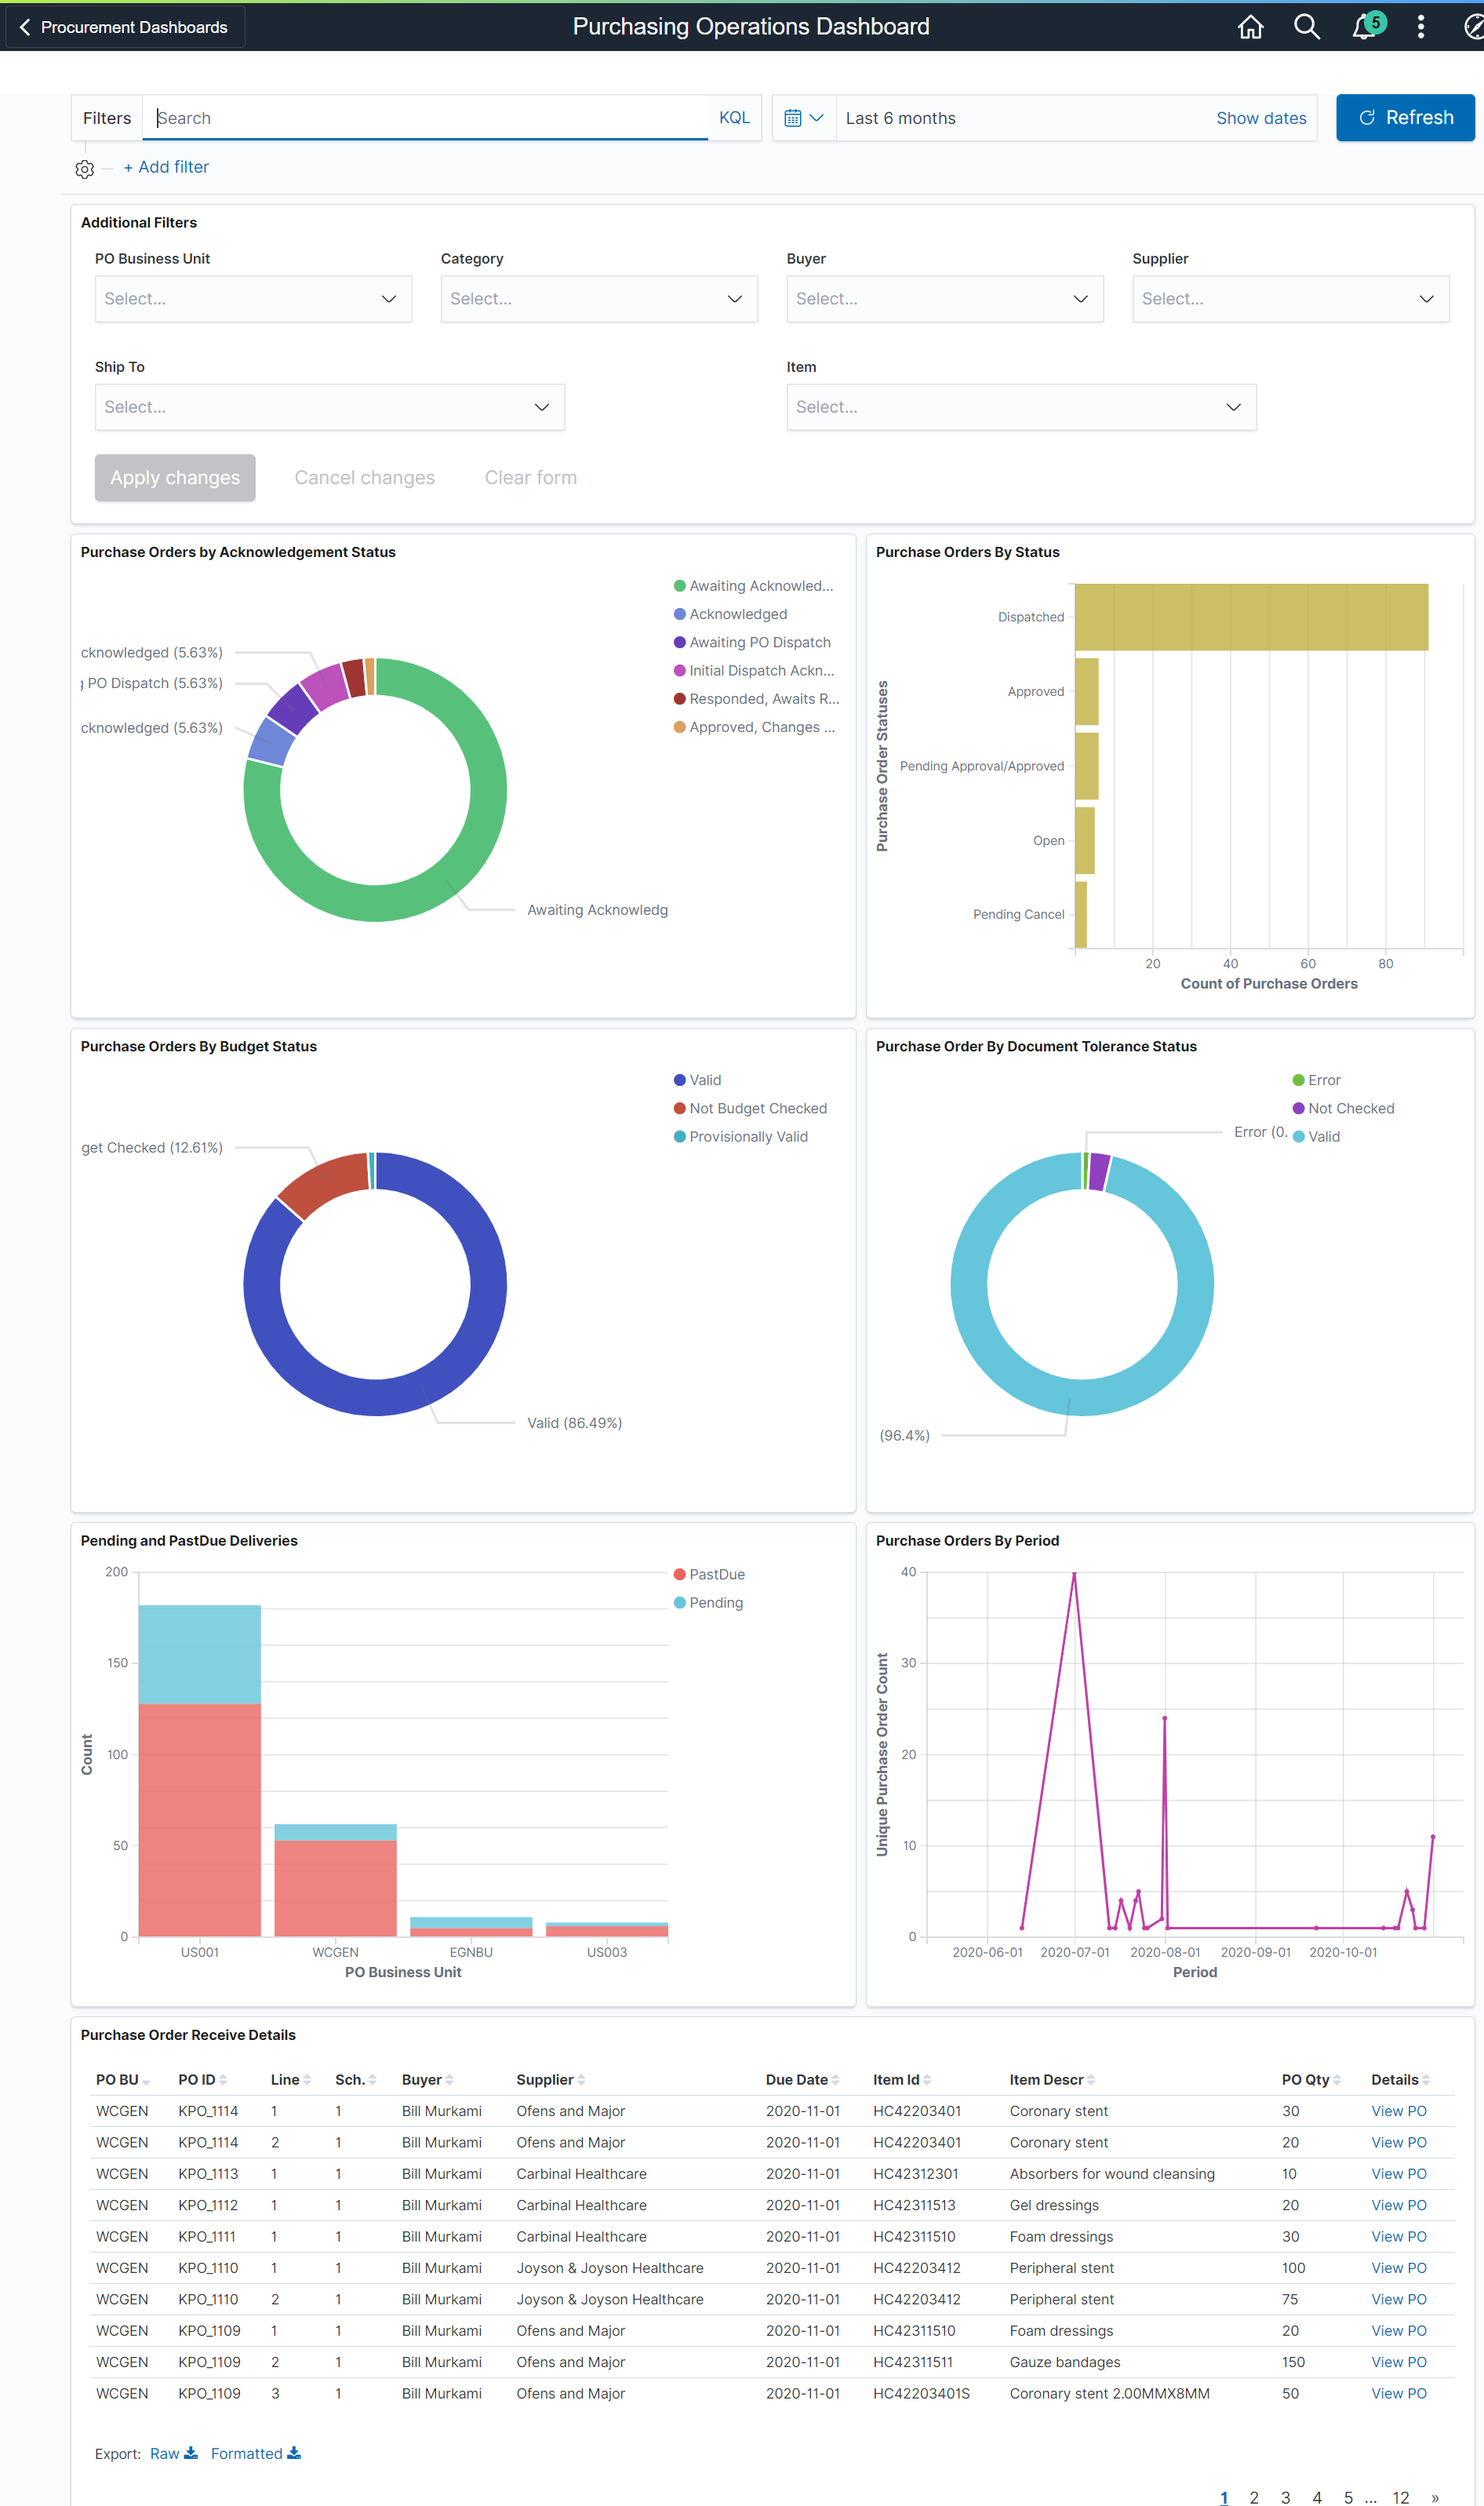
The Purchasing Operations dashboard helps buyers to analyze the current trend of purchase orders. You can apply different filters to modify data across all visualizations. Hover over different sections in the visualization to see the detailed statistics.
Visualizations that are part of this dashboard are:
Purchase Orders by Status — Shows the number of purchase orders by their statuses across all the business units. Purchase orders are displayed based on the date range that you have selected and the purchase order date. Cancelled and Completed purchase orders are excluded from this visualization.
Purchase Orders by Acknowledgement Status — Shows the number of purchase orders by their acknowledgement status. Purchase orders that do not require acknowledgement are excluded from this visualization.
Purchase Orders by Budget Status — Shows the number of purchase orders by their budget status. Purchase orders that do not require budget check are excluded from this visualization.
Purchase Orders by Period — Shows the number of purchase orders created over a time period based on the purchase order date. The time period can be set using the date picker.
Purchase Orders by Document Tolerance Status — Shows the number of purchase orders based on the status of document tolerance.
Pending and Past Due Deliveries — Shows the number of purchase orders by their business units that are pending or past their delivery due date. The Pending bar represents the purchase orders that are open either partially or fully, but with a due date in the future. The Past Due bar represents those schedules that are either not yet received or partially received, and past the due date. Non-purchase order receipts are excluded from this visualization as they do not have a stipulated due date.
At the bottom of the dashboard, The Purchase Order Receive Details table lists the purchase orders and items that match the applied filters. Click the View PO link of a purchase order to view or modify its details.
Use the Supplier Activity Analytics Insights to analyze the performance of suppliers based on the compliance to Service Level Agreement (SLA), quality, delivery performance, pricing, and POA responsiveness.
This dashboard monitors key performance indicators (KPIs) to measure supplier performance and ensure contractual obligations are met. The procurement administrator can view the procurement activity across several lines of business by drilling the visualization of specific buyers and/or suppliers.
Navigation:
Select the Supplier Activity Analytics tile.
This example illustrates the fields and controls on the Supplier Activity Analytics Insights page (1 of 3).

This example illustrates the fields and controls on the Supplier Activity Analytics Insights page (2 of 3).

This example illustrates the fields and controls on the Supplier Activity Analytics Insights page (3 of 3).

Visualizations that are part of this dashboard are:
Number of POs Dispatched by Buying Organization — Shows the number of POs dispatched by Buying Organization for each Supplier associated with the Supplier User.
Value of POs Dispatched by Buying Organization — Shows the total value of POs dispatched by Buying Organization for each Supplier associated with the Supplier User.
Number of POs Dispatched by Ship To Location — Shows the number of POs dispatched by Ship to Location for each Supplier associated with the Supplier User.
Pending and Past Due Purchase Orders by Supplier — Shows the PO schedules that are either not yet received or partially received, and the due date is in the past.
Delivery Performance Analysis by Supplier — Shows the delivery performance based on qualifiers. On Time: Received on the date mentioned as the due date in the PO. Early: Received before the due date. Late: Received after the due date.
Value of Shipment Rejections and Returns by Supplier — Shows the total amount of rejections and returns for each supplier associated with the Supplier User.
Value of Purchase Order Activity Trend by Supplier — Shows the total purchase volume based on the supplier, buying organization, or ship to location chosen.
POA Response Against Service Level Agreements — Shows the purchase order acknowledgment performance based on qualifiers. On Time: Acknowledgment on the date mentioned as the due date in Supplier/Bu level. Late: Acknowledged after the due date.
Number of POAs Pending and Past Due by Supplier — Shows the purchase order schedules that are either not yet acknowledged or partially acknowledged, and the due date is in the past.
Number of POAs by Acknowledgement Status by Supplier — Shows the count of unique POs for each PO acknowledgment status.
The detailed tabular view is also available for the Value of POs Dispatched by Ship To Location, Pending and Past Due Purchase Orders by Ship To Location, Delivery Performance Analysis by Ship To Location, and Value of Shipment Rejections and Returns by Ship To Location.
At the bottom of the dashboard, the Purchase Order Details table lists the purchase orders and items that match the applied filters. Click the Details link of a purchase order to view or modify its details on the Purchase Order Acknowledgment page.