Creating Graph-Display Templates
This topic provides an overview of graph-display templates and discusses how to create graph-display templates.
Templates are custom graphic layouts that you create, store, and reuse. Using the templates, you can simultaneously display one or more data-analysis tools in the Quality application client, making it possible to compare different graphs and charts for the same sets of data. For example, suppose you use a line graph, a bar graph, and a box plot to display a dataset. You can set up the Quality application client to display the three charts in the identical format for each dataset you examine.
You can also compare two datasets that are not identical, just similar. For example, if you create a layout using certain attributes or measurement columns, you can apply that layout to all similar datasets that have those columns defined. You can access data-analysis tools individually, using the Quality application client toolbar, or use the View menu.
To create graph-display layouts:
Open a dataset.
Select the dataset configuration using the Selector panel.
Select graphs using the buttons on the toolbar.
Size and position the graphs in the panel.
Select File, Save Layout.
Name the layout and select a place to save it.
The extension .tpl is automatically appended to the files.
The system saves the file to the same directory as dataset files on a workstation. Templates, like datasets, don't reside in the PeopleSoft database and should be considered workstation-specific.
Access the Quality application client.
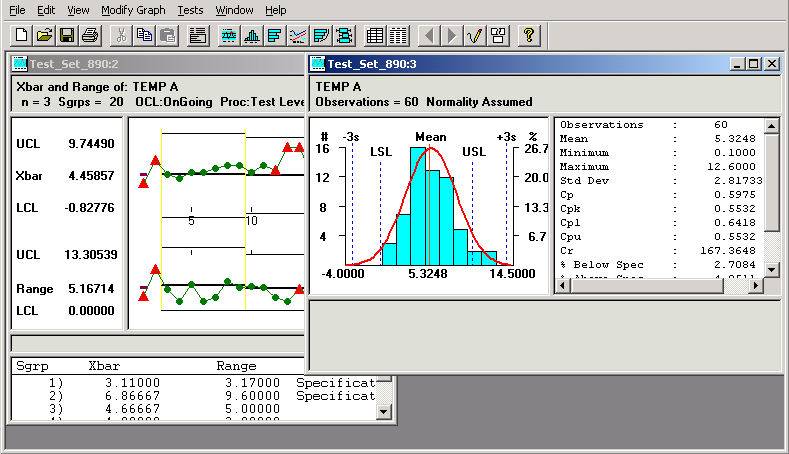
This example illustrates the fields and controls on the Example of graph-display layout. You can find definitions for the fields and controls later on this page.
To apply a layout, select File, Apply Layout. Each time you apply a different layout to the same data, the new layout replaces the previous one. The panels on the layout display the data from the currently selected dataset. If you open a different dataset and apply the same layout, you see the new data displayed in the same arrangement of panels.
You can change any of the charts in the layout the same as when you display the chart individually. To display the original layout, apply it again.