Creating and Managing Datasets
Use Quality application client panels to create and modify dataset configurations and content. From these panels, you access additional detail panels for maintaining specific dataset elements.
This topic discusses how to create and manage datasets.
|
Page Name |
Definition Name |
Usage |
|---|---|---|
|
None |
Add or change columns and subsets for an existing dataset or for configuring a new dataset. |
|
|
None |
Add or change cell values for a dataset. |
|
|
None |
Configure dataset columns and subsets. |
|
|
None |
Add common columns or data columns to a dataset. |
|
|
None |
Add subsets to a dataset. |
|
|
None |
Enter formulas to derive cell values for an entire column. |
Use the Spreadsheet page to add or change cell values for a dataset. Use the Selector page to add or change columns and subsets for an existing dataset or for configuring a new dataset.
Navigation:
This example illustrates the fields and controls on the Spreadsheet and Selector panels. You can find definitions for the fields and controls later on this page.
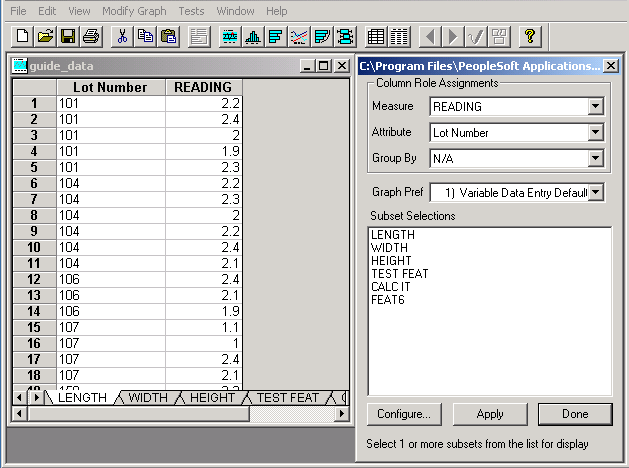
The Selector and Spreadsheet panels appear together when you initially launch the Quality application client from an extraction or when you open an existing dataset.
Using the Selector Panel
Use the Selector panel to manage dataset configurations, specify columns used for generating graphs, and to create or manipulate a dataset for analysis. You can:
Define columns and subsets.
Select the graph preference to use when performing analysis.
After you configure the dataset layout, enter the cell values that make up the dataset content in the columns and rows in the spreadsheet. The number of rows allowed is only limited by the available memory of a workstation.
After populating the dataset, you can select and manipulate information for analysis. For example, you can analyze one subset of data at a time or multiple subsets together and assign columns to roles for analysis. You can:
Select different subsets of data to analyze and graph.
Assign roles to columns for graphing and data-grouping purposes.
Change the graph preferences.
Add new common columns, data columns, and subsets to the dataset.
After configuring the dataset and entering data, you can access graphs using the Quality application client toolbar.
Field or Control |
Description |
|---|---|
Measure, Attribute, and Group By |
Select the columns used for producing graphs. If you are creating a new dataset, the system displays N/A (not applicable). |
Graph Pref (graph preference) |
Select the graph preference applied to this dataset. |
Subset Selections |
Select subsets to analyze and graph. |
Configure |
Click to access the Dataset Configuration panel. |
Apply |
Click to save changes you make to the settings. |
Done |
Click to exit the panel. |
Using the Spreadsheet
Use the Spreadsheet panel to:
Enter cell values for a new dataset.
View, add, change, or delete cell data associated with an existing dataset.
The Spreadsheet panel operates basically the same, whether you are adding data for the first time or modifying existing data. The program displays the data associated with an existing dataset on the spreadsheet. The spreadsheet is empty when you add data for the first time.
To enter data into a cell, either click the cell or use the arrow keys to navigate to the cell. To enter multiple lines into a tall cell, press the F2 button twice. You can also cut and paste the different cells within the spreadsheet, similar to using Microsoft Windows Excel.
Using Graphics
To perform data analysis using graphs:
Access the Selector and Spreadsheet panels.
All graphs use the Measure field, except the Pareto chart, which displays attributes information.
Select the column values to plot on the different graph displays using the Measure field.
This is also the data column used for calculating any statistics and tests. Only numeric columns are available for selection.
Select the Attribute column for the Pareto chart.
Only character columns are available for selection.
(Optional) Select the column to group by.
You specify an alternate data grouping using another column.
As an example, you can create subgroups based upon a traceability field (lot number), as an alternative to viewing the natural subgroup size defined for the subset. All readings corresponding to a unique value are grouped together.
Select the graph preference to apply for analysis and graphing.
Select one or more subsets under Subset Selections to analyze or view using the graphing tools.
Depending on the graphing tool, multiple subsets either overlay or are segmented when displayed. Available subsets are based on the dataset.
Note: You must select at least one subset to view any of the Quality application client displays, except for the spreadsheet.
As you make selections using the Selector panel, tool buttons become active on the Quality application client toolbar, indicating which graphs you can select.
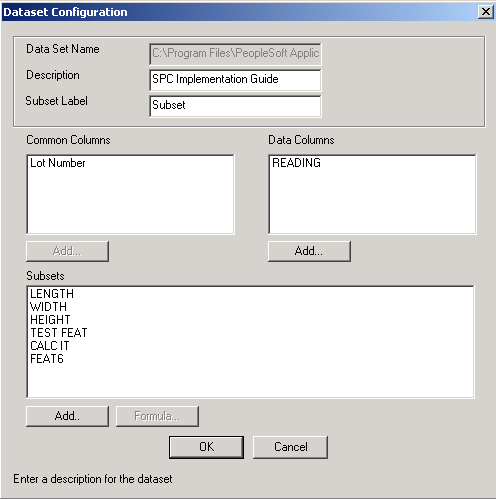
Use the Dataset Configuration dialog box to configure dataset columns and subsets.
Navigation:
Click the Configure button on the Selector panel.
This example illustrates the fields and controls on the Dataset Configuration dialog box. You can find definitions for the fields and controls later on this page.
The panel operates similarly for entering new data or changing data.
Field or Control |
Description |
|---|---|
Common Columns, Data Columns, and Subsets |
Define the structure of the dataset. Click the Add button under each field to access panels for defining columns or subsets. Note: Always add the different columns in the order in which they appear on the panel. Create common columns, then create data columns, and finally create subsets. You can't add common columns after adding data columns to a dataset. |
Add |
Click the buttons to access data-entry panels. Note: The button under Common Columns won't be accessible if you created the dataset using the extraction process or if you defined data columns. |
Formula |
Click this button to access the Subset/Column Detail panel and enter the formula for a measurement data column. Note: The Formula button becomes available when you select a measurement data column and a subset at the same time. |
Use the Column Detail panel to add common columns or data columns to a dataset.
Navigation:
Click the Add button under Common Columns or Data Columns on the Dataset Configuration panel.
Field or Control |
Description |
|---|---|
Name |
Identifies a dataset column. This name must be unique within the dataset. |
Column |
When you create columns in the dataset, they inherit properties from the selected column type, enabling the program to make assumptions about the new column and how to use it for analysis. The column type contains properties such as data type (character or numeric) and row type (single or multiple). This method minimizes the number of parameters required for defining columns in the dataset. Column type options include the following: 1) APPLICATION FIELD 2) STREAM COMPONENT 7) DATE AND TIME 8) VALUE 9) SUBGROUP SIZE 11) SEQUENCE 31) SUBGROUP STATUS 12) HCLIM 14) TEST VIOLATION 15) DEFECT 16) CAUSE 17) ACTION 20) COMMENT 28) SUBGROUP SEQUENCE 29) SAMPLE NO 30) SGRP STATUS 35) ATTRIBUTE TALLY |
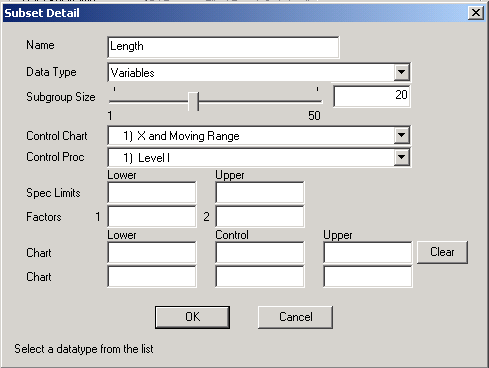
Use the Subset Detail panel to add subsets to a dataset.
Navigation:
Click the Add button under Subsets on the Dataset Configuration panel.
This example illustrates the fields and controls on the Subset Detail panel. You can find definitions for the fields and controls later on this page.
Field or Control |
Description |
|---|---|
Data Type |
Select from: Variables Defects Defectives |
Subgroup Size |
Enter the statistical process control subgroup size used for producing control charts and calculating subgroup statistics. |
Control Chart |
Select the control chart used for graphing the subset and evaluating process control. |
Control Proc (control procedure) |
Indicate the procedure used to evaluate process control. Note: The actual charts and control procedures listed depend on the configuration of the database. Available combinations include the following types. |
|
Data Type |
Available Control Charts |
|---|---|
|
Variables |
X and moving range Xbar and range Xbar and sigma |
|
Defects |
c chart u chart |
|
Defectives |
p chart np chart |
The current process control limits appear from the database if the dataset you are using was created using an extraction or inquiry.
Use the Subset/Column Detail panel to enter formulas to derive cell values for an entire column.
Navigation:
Click the Formula button on the Dataset Configuration panel.
The upper portion of the panel displays the subset and data column that you selected.
Field or Control |
Description |
|---|---|
Formula |
Enter a formula that applies to the measurement column and subset combination. The formula behaves similarly to the formula used to derive characteristics in measurement plans. For example, you use a formula when prototyping or characterizing a process that in actual use derives characteristics, or to derive costs from live data by appending a subset (characteristic) to a dataset that has been extracted from the database. |