Using Distribution Analysis
Use the Quality application client to view and interact with histograms, box plots, Pearson distribution types, and basic statistics. Quality provides the following single sample statistical confidence tests:
A t-test, to test the mean of the current population versus a target mean supplied by you.
A chi-square test, to test the standard deviation of the current population versus a target standard deviation that you supply.
This section discusses how to:
Use histogram statistics.
Use test statistics.
The following table lists equations that apply to histogram statistics:
|
Equation |
Statistic |
|---|---|


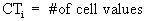
|
The number of cells is a calculated value that determines the number of bars to be displayed on a histogram. |

|
The cell width represents the size of each cell interval. |


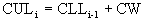
|
The cell lower limit is the lower class limit for each cell (i) within the histogram. The first cell (i=1) must be calculated, and then subsequent cell limits can be calculated using the second equation. |
|
The cell upper limit is the upper class limit for each cell within the histogram. |
|
The cell tally is the total number of individual values in a cell. |

|
The cell percentage is the percentage of individual values in a cell. |
The following table lists the two single sample statistical confidence tests: a mean test and a Stdev test (standard deviation test).
|
Equation |
Statistic |
|---|---|
|
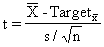
The mean test is a t-test that tests the mean of the current sample versus a target mean that you supply. Once the t value is calculated, it is compared to the t statistic (table value), which is determined by the confidence level selected for a one-sided test. The test assumes that the samples are normally distributed. See References. |
|
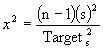
The standard deviation test is a chi-square test that tests the standard deviation of the current sample versus a target standard deviation that you supply. Once the chi-square value is calculated, it is compared to the chi-square statistic (table value), which is determined by the confidence level selected for the test. The standard deviation test has a limitation of 
= 100. See References. |