Viewing Related Content Charts for Job Openings
This topic discusses the two charts that are delivered as related content for job openings.
|
Page Name |
Definition Name |
Usage |
|---|---|---|
|
HRS_JO_CHART1 |
View a line chart showing job opening applications received and rejected over time. In accessible mode, the data appears in a grid rather than a line chart. |
|
|
HRS_JO_CHART2 |
View a pie chart showing the number of job opening applicants in each recruiting phase. In accessible mode, the data appears in a grid rather than a pie chart. |
Charts to help you understand the recruiting activity for a job opening are available as related content from the Manage Job Opening Page.
Access the charts using the Related Content link that appears at the top of the Manage Job Opening page.
This example illustrates the Related Content menu on the Manage Job Opening page.
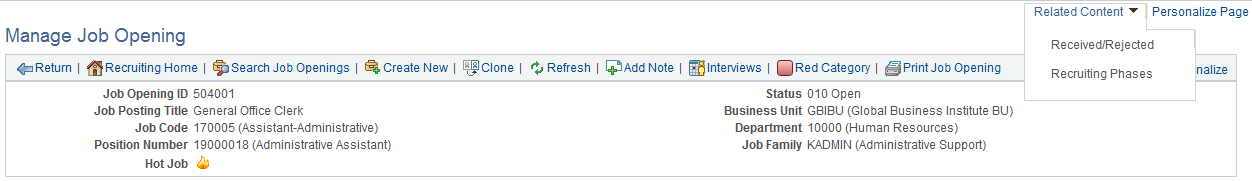
When you select a specific chart from the Related Content menu, the chart appears in the bottom half of a split screen, while top half of the split screen continues to display the job opening.
The related content portion of the split screen displays tabs for each chart so that you can switch charts without returning to the Related Content menu.
Use the Received/Rejected page (HRS_JO_CHART1) to view a line chart showing job opening applications received and rejected over time.
Navigation:
On the Manage Job Openings page, select the Related Content link, then select Received/Rejected from the related content menu.
This example illustrates the Received/Rejected chart.
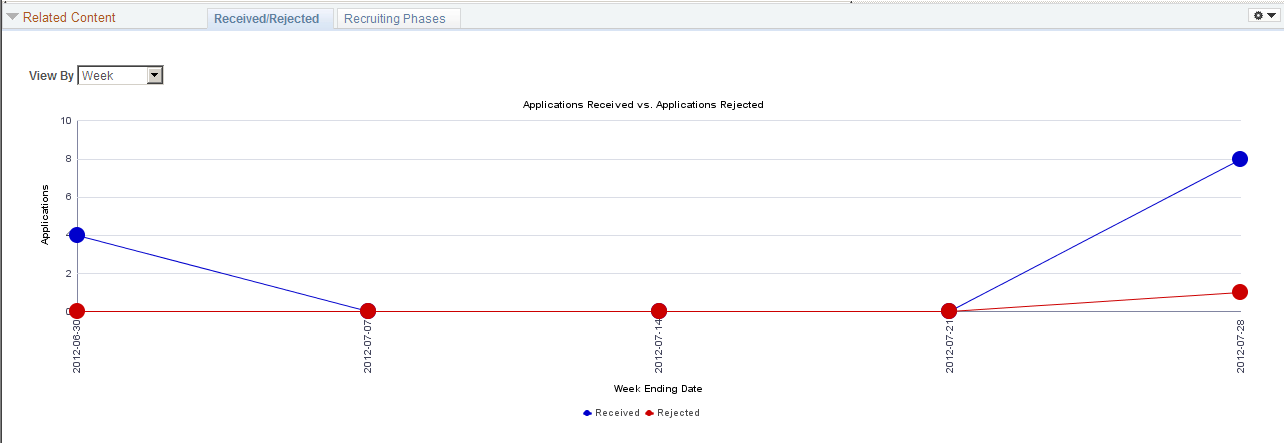
The chart displays dates raging from the date that the job opening was first linked to an application through the date of the most recent disposition change.
To see the exact number of applicants associated with a data point, place the cursor over the data point to show the mouseover text.
Field or Control |
Description |
|---|---|
View By |
Choose whether to totals by Week or by Month. The chart uses the last day of each time period as the label for the time period Users can personalize the first day of the week by selecting My Personalizations from the main PeopleSoft menu. |
Received |
The Received data points show the number of applications that were initially linked to the job opening during the time period. The chart ignores draft application and applications that were linked with status 112 - Failed Prescreening, as failing prescreening prevents an applicant from applying for the job opening. |
Rejected |
The Rejected data points show the number of applications that were moved to the rejected phase during the time period. The chart ignores draft applications and applications that were assigned status 112 - Failed Prescreening, as applicants who fail prescreening are not considered to have applied. |
Use the Recruiting Phases page (HRS_JO_CHART2) to view a pie chart showing the number of job opening applicants in each recruiting phase.
Navigation:
On the Manage Job Openings page, select the Related Content link, then select Recruiting Phases from the related content menu.
This example illustrates the Recruiting Phases chart.
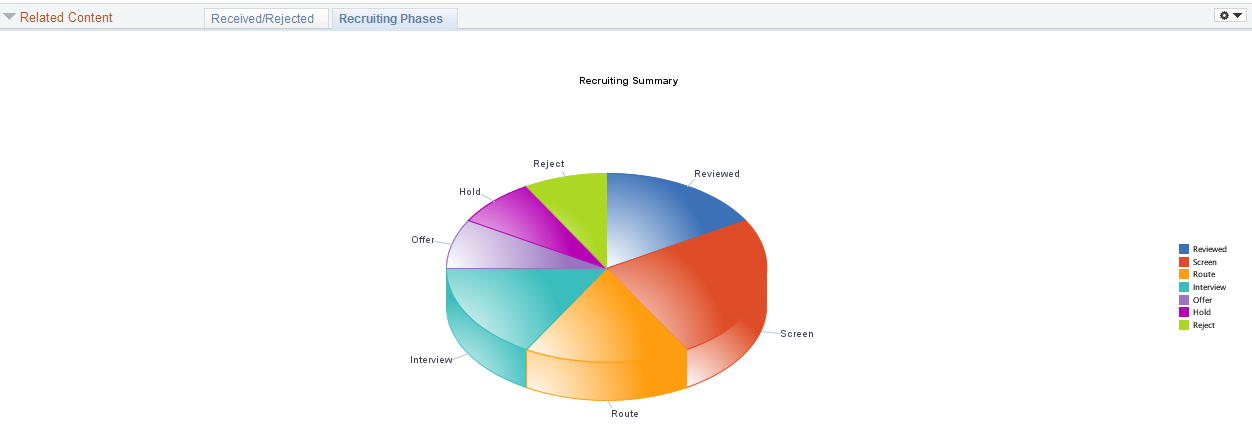
This is a standard pie chart showing the distribution of applicants across recruiting phases. To see the exact number of applicants in a particular phase, place the cursor over the pie segment to show the mouseover text.