Maintaining Social Security Tables
This topic provides an overview of maintaining social security tables and discusses how to view social security tables.
|
Page Name |
Definition Name |
Usage |
|---|---|---|
|
PA_TL_MAX_WAGE |
View the maximum taxable wage base, which is the cap on the wages that are considered for social security purposes. |
|
|
PA_TL_NATL_AV_WAGE |
View the national average wage statistics published by the U.S. Department of Labor. |
|
|
PA_TL_CPI_INCR |
View the consumer price index increases by year. |
|
|
PA_DLAY_CRD_PCT |
View the allowable delayed retirement increase percentage for each year. |
|
|
PA_SS_DROP_TBL |
View the number of years to drop, based on age at the time of disability. Calculating social security disability benefits involves dropping a certain number of years from the employee's wage history before determining the average wage. |
Social security calculations use a number of tables published annually by the Social Security Administration. PeopleSoft delivers and maintains five social security tables.
The pages in this section display the information in these tables. Because PeopleSoft maintains this information, it is unlikely that you will need to edit it. However, if you choose, you can enter new values as they become available.
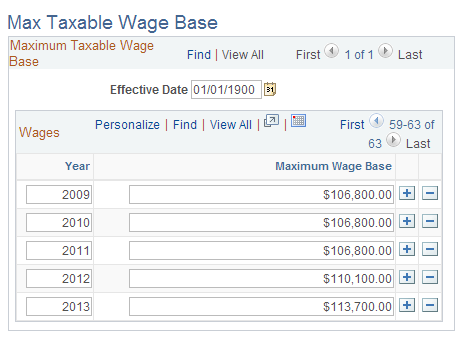
Use the Max Taxable Wage Base page (PA_TL_MAX_WAGE) to view the maximum taxable wage base, which is the cap on the wages that are considered for social security purposes.
Navigation:
This example illustrates the fields and controls on the Max Taxable Wage Base page.
Use the National Average Wage page (PA_TL_NATL_AV_WAGE) to view the national average wage statistics published by the U. S. Department of Labor.
Navigation:
This example illustrates the fields and controls on the National Average Wage page.
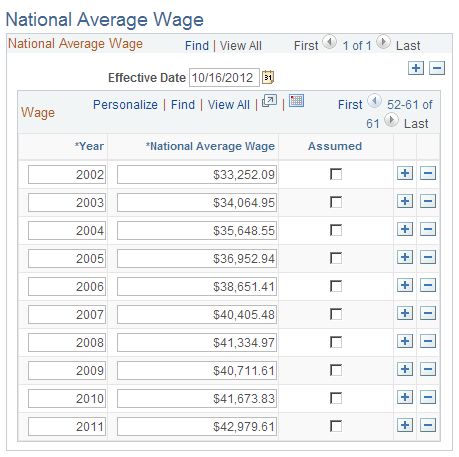
Each effective-dated row consists of a year and the associated national average wage.
When the Department of Labor publishes these values, final information for the previous two years is only available as estimates. For example, in 1998, there was no data for 1998, there were estimates for 1997 and 1996, and there was final data for all prior years. In 1999, the estimated average wage for 1996 is replaced with a final amount. Overwriting the estimate would make historical calculations invalid because a calculation for an employee who terminated in 1998 uses the rules as of 1998. It cannot use information that was not available then. Therefore, a new effective-dated table is added every year, and both the estimate and the final value are available when needed.
The two estimates are marked Assumed and are known as the "lag years."
On the Social Security - Earnings Basis page, you can use the Lag Year Regression Method to specify how to treat lag year data in social security calculations.
Use the Consumer Price Index (CPI-W) page (PA_TL_CPI_INCR) to view the consumer price index increases by year.
Navigation:
This example illustrates the fields and controls on the Consumer Price Index (CPI-W) page.
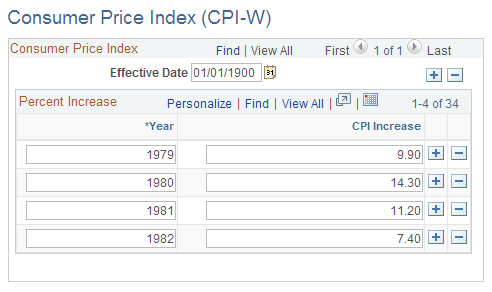
When the system calculates social security benefits, it uses the Consumer Price Index (CPI) to incorporate annual cost of living adjustments between the year of eligibility and the year the social security benefits are assumed to commence.
The Social Security Act requires that the cost of living increase be based on the CPI for urban wage earners and clerical workers for the quarter ending each September 30 (the average for the months of July, August, and September).
Each effective-dated row contains a year and the associated CPI increase rate.
Use the Delayed Retirement Credit page (PA_DLAY_CRD_PCT) to view the allowable delayed retirement increase percentage for each year.
Navigation:
This example illustrates the fields and controls on the Delayed Retirement Credit page.
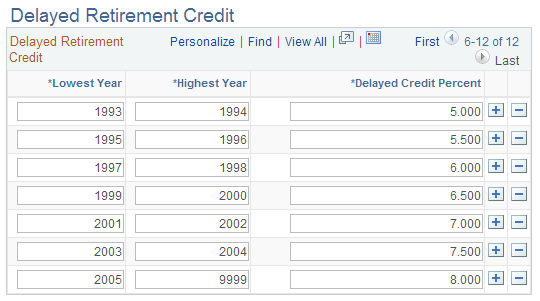
Each row consists of a lowest year, a highest year, and the associated delayed credit percent for that range.
Note: Each delayed credit value applies to a specified range of years. This display format is slightly different from the previous tables, which show only one value for each individual year.
If you edit this table, be sure not to set up overlapping rows. For example, if you set up rows for 1980-1990 and 1990-2000, there are two rows for 1990.
Use the Disability Drop Years page (PA_SS_DROP_TBL) to view the number of years to drop, based on age at the time of disability.
Navigation:
This example illustrates the fields and controls on the Disability Drop Years page.
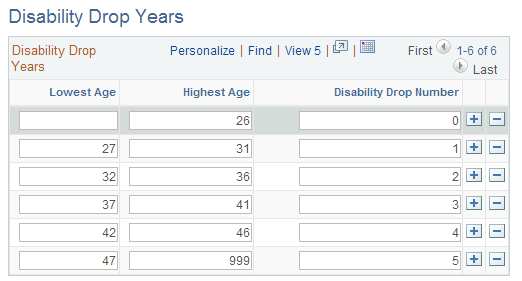
Each row consists of a lowest age, a highest age, and the associated disability drop number. The disability drop number is the number of years to drop for employees becoming disabled within that age range.
Note: Be sure not to set up overlapping rows. For example, if you set up rows for 37-41 and 41-46, there are two rows for age 41.