Using Time and Labor WorkCenter Pivot Grids
This section provides an overview of Time and Labor pivot grids.
PeopleSoft Pivot Grid is a PeopleTools technology that provides operational dashboard reporting in the form of a grid, chart, or both. Pivot grids enable users to visually display real-time data and organize it on the fly by performing operations such as pivoting and filtering.
Video: PeopleSoft Actionable Operational Analytics
The Time and Labor WorkCenter delivers four pivot grids that provide graphic views of operational information, enabling users to monitor business processes and take relevant actions:
The Timesheet by Status chart displays the number of occurrences for each of the reported timesheet statuses for the specified employees and dates.
The Attendance Violations chart shows the number of occurrences for each of the retrieved attendance violations for the specified employees and dates.
The Absence Type - Absence Management chart shows the number of occurrences for each of the retrieved absence types (sick, vacation, etc.) for the specified employees and dates using PeopleSoft Absence Management information.
The Absence Types - Benefits chart shows the number of occurrences for each of the retrieved absence types (sick, vacation, etc.) for the specified employees and dates using PeopleSoft Base Benefits information.
Important! In order to populate the TL_JOB_EMPL_DAT table with Job data and Time and Labor Employee data for an employee, you must run the TL_PG_EMPDAT Application Engine process. . This record is used in pivot grids to retrieve job data for an employee.
Use the PeopleTools Process Request Dialog page to initiate the process. Navigate to: .
See the product documentation for PeopleTools: PeopleSoft Process Scheduler
For more information on the setup and capabilities of PeopleSoft Pivot Grids, see PeopleTools: PeopleSoft Pivot Grid.
These page controls appear on all Time and Labor pivot grids:
Field or Control |
Description |
|---|---|
|
Click to open the Options Menu, then select from these menu items::
|
Filters |
Displays drop-down list boxes that you use to filter the data to be displayed in the chart. |
Drilldown Menu |
When you click a data element (for example, a bar on a bar chart), a menu provides these options:
|
|
Page Name |
Definition Name |
Usage |
|---|---|---|
|
TL_RPTD_IRPT |
Displays the number of occurrences for each reported timesheet status for a manager’s employees within the specified dates. Using Related Actions on the drill down grid you can access the Timesheet page. |
|
|
TL_ATTP_IRPT |
Displays the number of occurrences for each of the retrieved attendance violations for a manager’s employees within the specified dates. Using Related Actions on the drill down grid you can access the Timesheet page. |
|
|
TL_ABST_IRPT |
Displays the number of occurrences for each of the retrieved absence types (for example sick and vacation) for a manager’s employees within the specified dates, using PeopleSoft Absence Management information. Using Related Actions on the drill down grid you can access the Timesheet page. |
|
|
TL_ABST_IRPT_BC |
Displays the number of occurrences for each of the retrieved absence types (for example sick and vacation) for a manager’s employees within the specified dates, using PeopleSoft Base Benefits information. Using Related Actions on the drill down grid you can access the Timesheet page. |
|
|
TL_PT_TREND_IRPT |
Displays a detailed report for estimated gross on the basis of selected data range, using Time and Labor information. The report helps in comparing data between current time and historical payable time. For example Comparing Overtime cost during current pay period and previous pay. The default report is in the form of two-dimensional bar chart. Using Related Actions on the drill down grid you can access the Timesheet page. |
|
|
TL_TIME_CAT_IRPT |
Displays a comparison report on Payable Time based on the time categories for the duration provided. This allows comparing data like overtime versus regular, productive versus non-productive time. Using Related Actions on the drill down grid you can access the Timesheet page. |
|
|
TL_LBR_IRPT |
Displays an analysis report for the labor cost in terms of productivity or time categories. The Labor costs pivot grid depicts a bar chart with estimated gross for the employees calculated under different department ids. Using Related Actions on the drill down grid you can access the Timesheet page. |
|
|
TL_PYTST_IRPT |
Displays an insight to statuses that require monitoring and enables the user to take appropriate actions on these payable statuses. |
Use the Timesheet by Status pivot grid (TL_RPTD_IRPT) to display the number of occurrences for each reported timesheet status for a manager’s employees within the specified dates.
Navigation:
Select the Reports/Processes tab, then select the Timesheet by Status link.
This example illustrates the Timesheet by Status pivot grid.
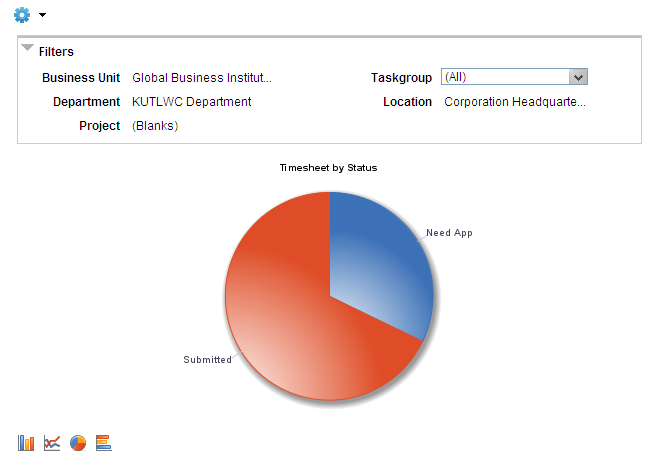
The Timesheet by Status pivot grid displays timesheet status data from TL_RPTD_TIME in a pie chart. A manager can view a summary of the timesheet status for all of the manager’s employees. The manager can filter the information using different levels of detail.
The grid view of this chart provides a link to the related Timesheet.
Chart Content and Layout
|
Option |
Details |
|---|---|
|
From and To |
Enter the starting and ending dates to define the date range for the pivot grid. |
|
Generate Report |
Select to display the pivot grid, based on the specified employees and the date range specified for the pivot grid. |

Prompts |
Enter a specific value for any of the listed fields to modify the displayed pivot grid. The available fields are Start Date, Dept ID, Supervisor ID, Reports to, Location, Company, Pay Group, Paygroup_GP, Workgroup, Taskgroup, Position, End Date, Time Group, Empl ID, Empl Record, First Name, Last Name, Business Unit, Job Code, Job Descr. |
|
Filters |
|
|
Drill-down options |
|
|
Chart type options |
|
Use the Attendance Violations pivot grid (TL_ATTP_IRPT) to view the number of occurrences for each of the retrieved attendance violations for a manager’s employees within the specified dates.
Navigation:
Select the Reports/Processes tab, then select the Attendance Violations link.
This example illustrates the Attendance Violations pivot grid
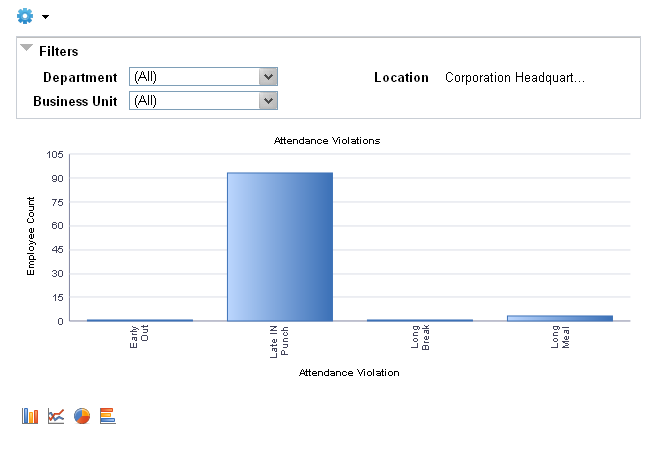
The Attendance Violations pivot grid displays the attendance violations from the TL_Attendance table for a manager’s employees. The pivot grid displays the data in a bar chart.
The grid view of this chart provides a link to the related Timesheet.
Important! You must use PeopleSoft Attendance Tracking to control time and administer attendance in order to see data in this pivot grid.
For more information, see: Defining Attendance Programs
Chart Content and Layout
The following table describes options for manipulating the chart:
|
Option |
Details |
|---|---|
|
Prompts |
Enter a specific value for any of the listed fields to modify the displayed pivot grid. The available fields are Start Date, Dept ID, Supervisor ID, Reports to, Location, Company, Pay Group, Paygroup_GP, Workgroup, Taskgroup, Position, End Date, Time Group, Empl ID, Empl Record, First Name, Last Name, Business Unit, Job Code, Job Descr. |
|
Filters |
|
|
Drill-down options |
|
|
Chart type options |
|
Use the Absence Type - Absence Mgmt (Absence Type - Absence Management) pivot grid (TL_ABST_IRPT) to view the number of occurrences for each of the retrieved absence types (sick, vacation, etc.) for a manager’s employees within the specified dates, using PeopleSoft Absence Management information.
Navigation:
Select the Reports/Processes tab, then select the Absence Type - Absence Mgmt link.
This example illustrates the Absence Type - Absence Mgmt pivot grid.
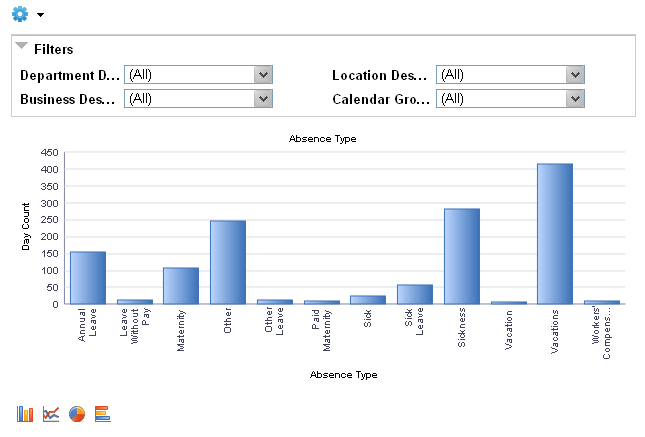
The Absence Type - Absence Mgmt pivot grid displays the Absence Management absence types used by a manger’s employees for a specified time period. The pivot grid displays the data from the GP_ABS_EVENT table in a bar chart.
The Day Count on the chart is shown in calendar days. The grid view of this chart provides links to the Absence Events for the displayed data.
The grid view of this chart provides a link to the related Timesheet.
Important! This chart relies on data from PeopleSoft Absence Management or Global Payroll in order to display the information in the chart.
Chart Content and Layout
The following table describes options for manipulating the chart:
|
Option |
Details |
|---|---|
|
Prompts |
Enter a specific value for any of the listed fields to modify the displayed pivot grid. The available fields are Start Date, Dept ID, Supervisor ID, Reports to, Location, Company, Pay Group, Paygroup_GP, Workgroup, Taskgroup, Position, End Date, Time Group, Empl ID, Empl Record, First Name, Last Name, Business Unit, Job Code, Job Descr. |
|
Filters |
|
|
Drill-down options |
|
|
Chart type options |
|
Use the Absence Types - Benefits pivot grid (TL_ABST_IRPT_BC) to view the number of occurrences for each of the retrieved absence types (sick, vacation, etc.) for a manager’s employees within the specified dates, using PeopleSoft Base Benefits information.
Navigation:
Select the Reports/Processes tab, then select the Absence Types - Benefits link.
This example illustrates the Absence Types - Benefits pivot grid.
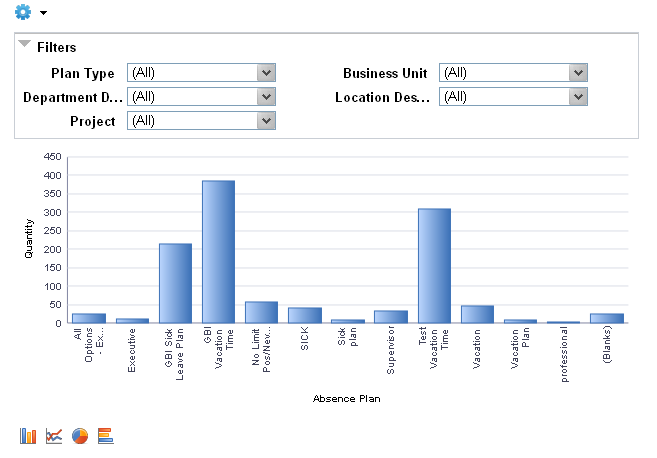
The Absence Types - Benefits pivot grid displays data from the TL_RPTD_TIME table in a bar chart. The Day Count on the chart is shown in calendar days. The grid view of this chart provides a link to the related Timesheet.
Chart Content and Layout
The following table describes options for manipulating the chart:
|
Option |
Details |
|---|---|
|
Prompts |
Enter a specific value for any of the listed fields to modify the displayed pivot grid. The available fields are Start Date, Dept ID, Supervisor ID, Reports to, Location, Company, Pay Group, Paygroup_GP, Workgroup, Taskgroup, Position, End Date, Time Group, Empl ID, Empl Record, First Name, Last Name, Business Unit, Job Code, Job Descr. |
|
Filters |
|
|
Drill-down options |
|
|
Chart type options |
|
Use the Payable Time Trend pivot grid (TL_PT_TREND_IRPT) page to view a detailed report for estimated gross on the basis of selected data range.
Navigation:
. Select theReports/Processes tab, then select the Payable Time Trend link.
This example illustrates the Absence Types - Payable Time Trend pivot grid.
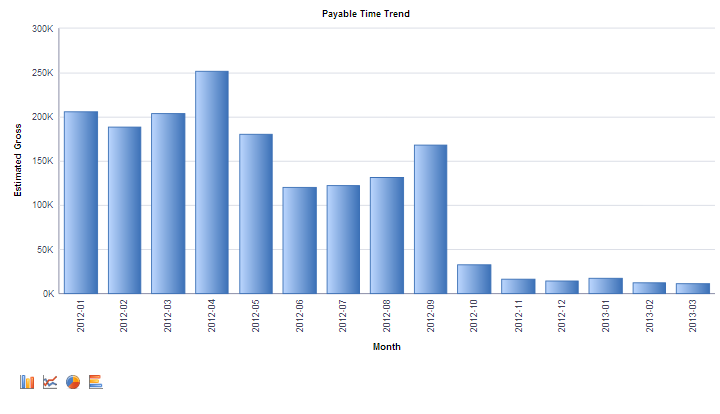
The Payable Time Trend Pivot Grid allows This allows comparing data like overtime versus regular, productive versus non-productive time.
As the report is based on payable time table, run absence conversion for the required time period for which the user is generating the report.
To compare between two different TRC Categories, enter values in TRC Category 1 and TRC Category 2.
Chart Content and Layout
The following table describes options for manipulating the chart:
|
Option |
Details |
|---|---|
|
From and To |
Enter the starting and ending dates to define the date range for the pivot grid. |
|
Generate Report |
Select to display the pivot grid, based on the specified employees and the date range specified for the pivot grid. |
|
Prompts |
Enter a specific value for any of the listed fields to modify the displayed pivot grid. The available fields are Start Date, Dept ID, Supervisor ID, Reports to, Location, Company, NA Pay Group, Paygroup_GP, Workgroup, Taskgroup, Position Number, End Date, Time Reporter Group, TRC Category, Employee ID, Employee RecordFirst Name, Last Name, Business Unit, Job Code, Job Description. |
|
Filters |
|
|
Drill-down options |
|
|
Chart type options |
|
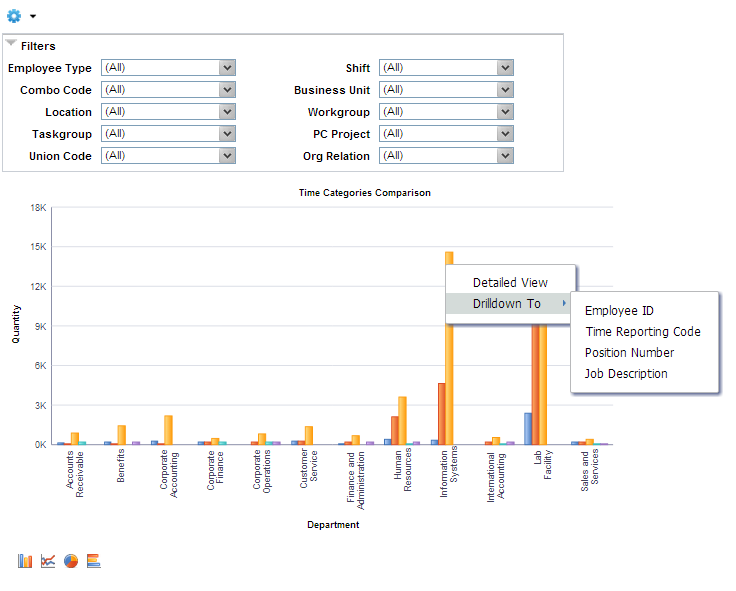
Use the Time Categories Comparison pivot grids (TL_TIME_CAT_IRPT) page to display a comparison report on Payable Time based on the time categories for the duration provided.
Navigation:
Select the Reports/Processes tab, then select the Time Categories Comparison link.
This example illustrates the Absence Types - pivot grid
The Timesheet by Status pivot grid displays timesheet status data from TL_RPTD_TIME in a pie chart. A manager can view the summary of the timesheet status for all of the manager’s employees. The manager can filter the information using different levels of detail.
The grid view of this chart provides a link to the related Timesheet.
Chart Content and Layout
The following table describes options for manipulating the chart:
|
Option |
Details |
|---|---|
|
From and To |
Enter the starting and ending dates to define the date range for the pivot grid. |
|
Generate Report |
Select to display the pivot grid, based on the specified employees and the date range specified for the pivot grid. |
|
Prompts |
Enter a specific value for any of the listed fields to modify the displayed pivot grid. The available fields are Start Date, Dept ID, Supervisor ID, Reports to, NA Pay Group, GP Pay Group, Workgroup,Taskgroup, Position Number, End Date, Time Reporter Group,TRC Category 1 TRC Category 2, Employee ID, Empl Record, First Name, Last Name, Business Unit, Job Code, Job Description. |
|
Filters |
|
|
Drill-down options |
|
|
Chart type options |
|
Use the Labor Costs pivot grids (TL_LBR_IRPT) page to view an analysis report for the labor cost in terms of productivity or time categories.
Navigation:
Select the Reports/Processes tab, then select the Labor Costs link.
This example illustrates the Absence Types - Labor Costs pivot grid
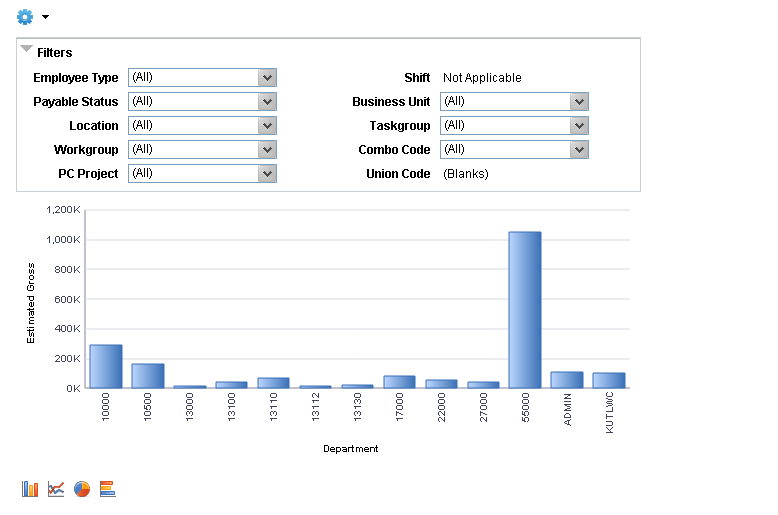
The Labor costs pivot grid depicts a bar chart with estimated gross for the employees calculated under different department ids.
The grid view of this chart provides a link to the related Timesheet.
Chart Content and Layout
The following table describes options for manipulating the chart:
|
Option |
Details |
|---|---|
|
From and To |
Enter the starting and ending dates to define the date range for the pivot grid. |
|
Generate Report |
Select to display the pivot grid, based on the specified employees and the date range specified for the pivot grid. |
|
Prompts |
Enter a specific value for any of the listed fields to modify the displayed pivot grid. The available fields are Start Date, Dept ID, Supv ID, Reports to, Location, Company, Pay Group,Workgroup, Taskgroup, Position, End Date, Time Group, TRC Category, ID, Empl Record, First Name, Last, Unit, Job Code, Job Descr. |
|
Filters |
|
|
Drill-down options |
|
|
Chart type options |
|
Use the Payable by Status page (TL_PYTST_IRPT) to get an insight to statuses that require monitoring and enables the user to take appropriate actions on these payable statuses.
Navigation:
Select the Reports/Processes tab, then select the Payable Time by Status link.
This example illustrates the Absence Types - Payable Time by Status pivot grid
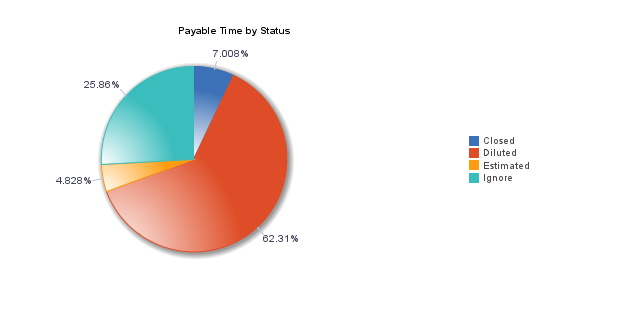
The grid view of this chart provides a link to the related Timesheet.
Chart Content and Layout
The following table describes options for manipulating the chart:
|
Option |
Details |
|---|---|
|
From and To |
Enter the starting and ending dates to define the date range for the pivot grid. |
|
Generate Report |
Select to display the pivot grid, based on the specified employees and the date range specified for the pivot grid. |
|
Prompts |
Enter a specific value for any of the listed fields to modify the displayed pivot grid. The available fields are Begin Date, Department, Supervisor ID, Reports to Position Number, Location, Company, NA Pay Group, GP Pay Group Workgroup, Taskgroup, Position Number, End Date, Time Reporter Group, Employee ID, Empl Record, First Name, Last Name, Business Unit, Job Code, Job Description. |
|
Filters |
|
|
Drill-down options |
|
|
Chart type options |
|