Analyzing Enterprise Components Using PeopleSoft Insights
This topic displays and explains how to analyze Enterprise Components data using PeopleSoft Insights dashboards.
|
Page Name |
Definition Name |
Usage |
|---|---|---|
|
EOCC_CHGTRK_ANALYTICS |
Analyze the history of changes for transactions by product, component, record, field, and user. |
Use the Change Tracking Analytics (EOCC_CHGTRK_ANALYTICS) to analyze the history of changes for transactions by product, component, record, field, and user.
Navigation:
Select the Change Tracking Analytics tile.
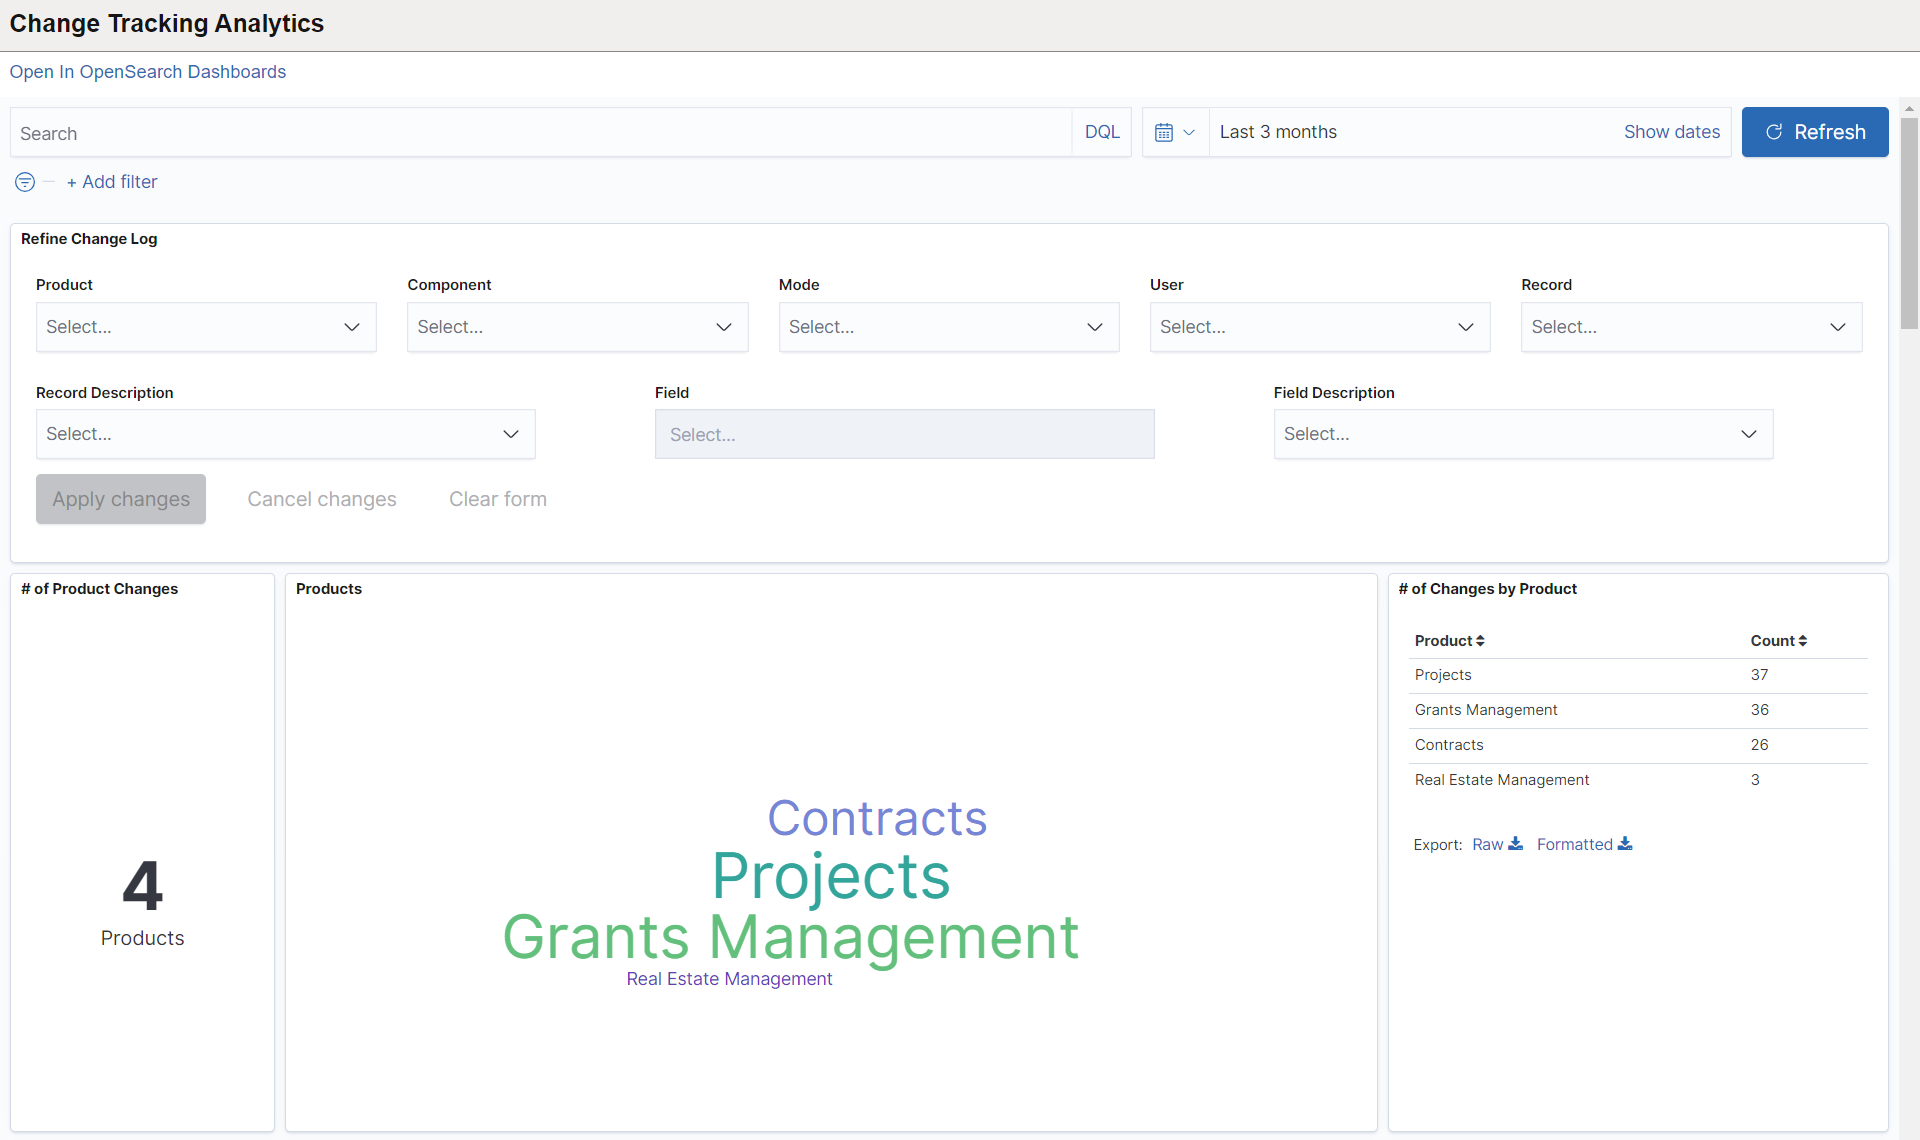
This example illustrates the fields and controls on the Change Tracking Analytics page (1 of 3). You can find definitions for the fields and controls later on this page.
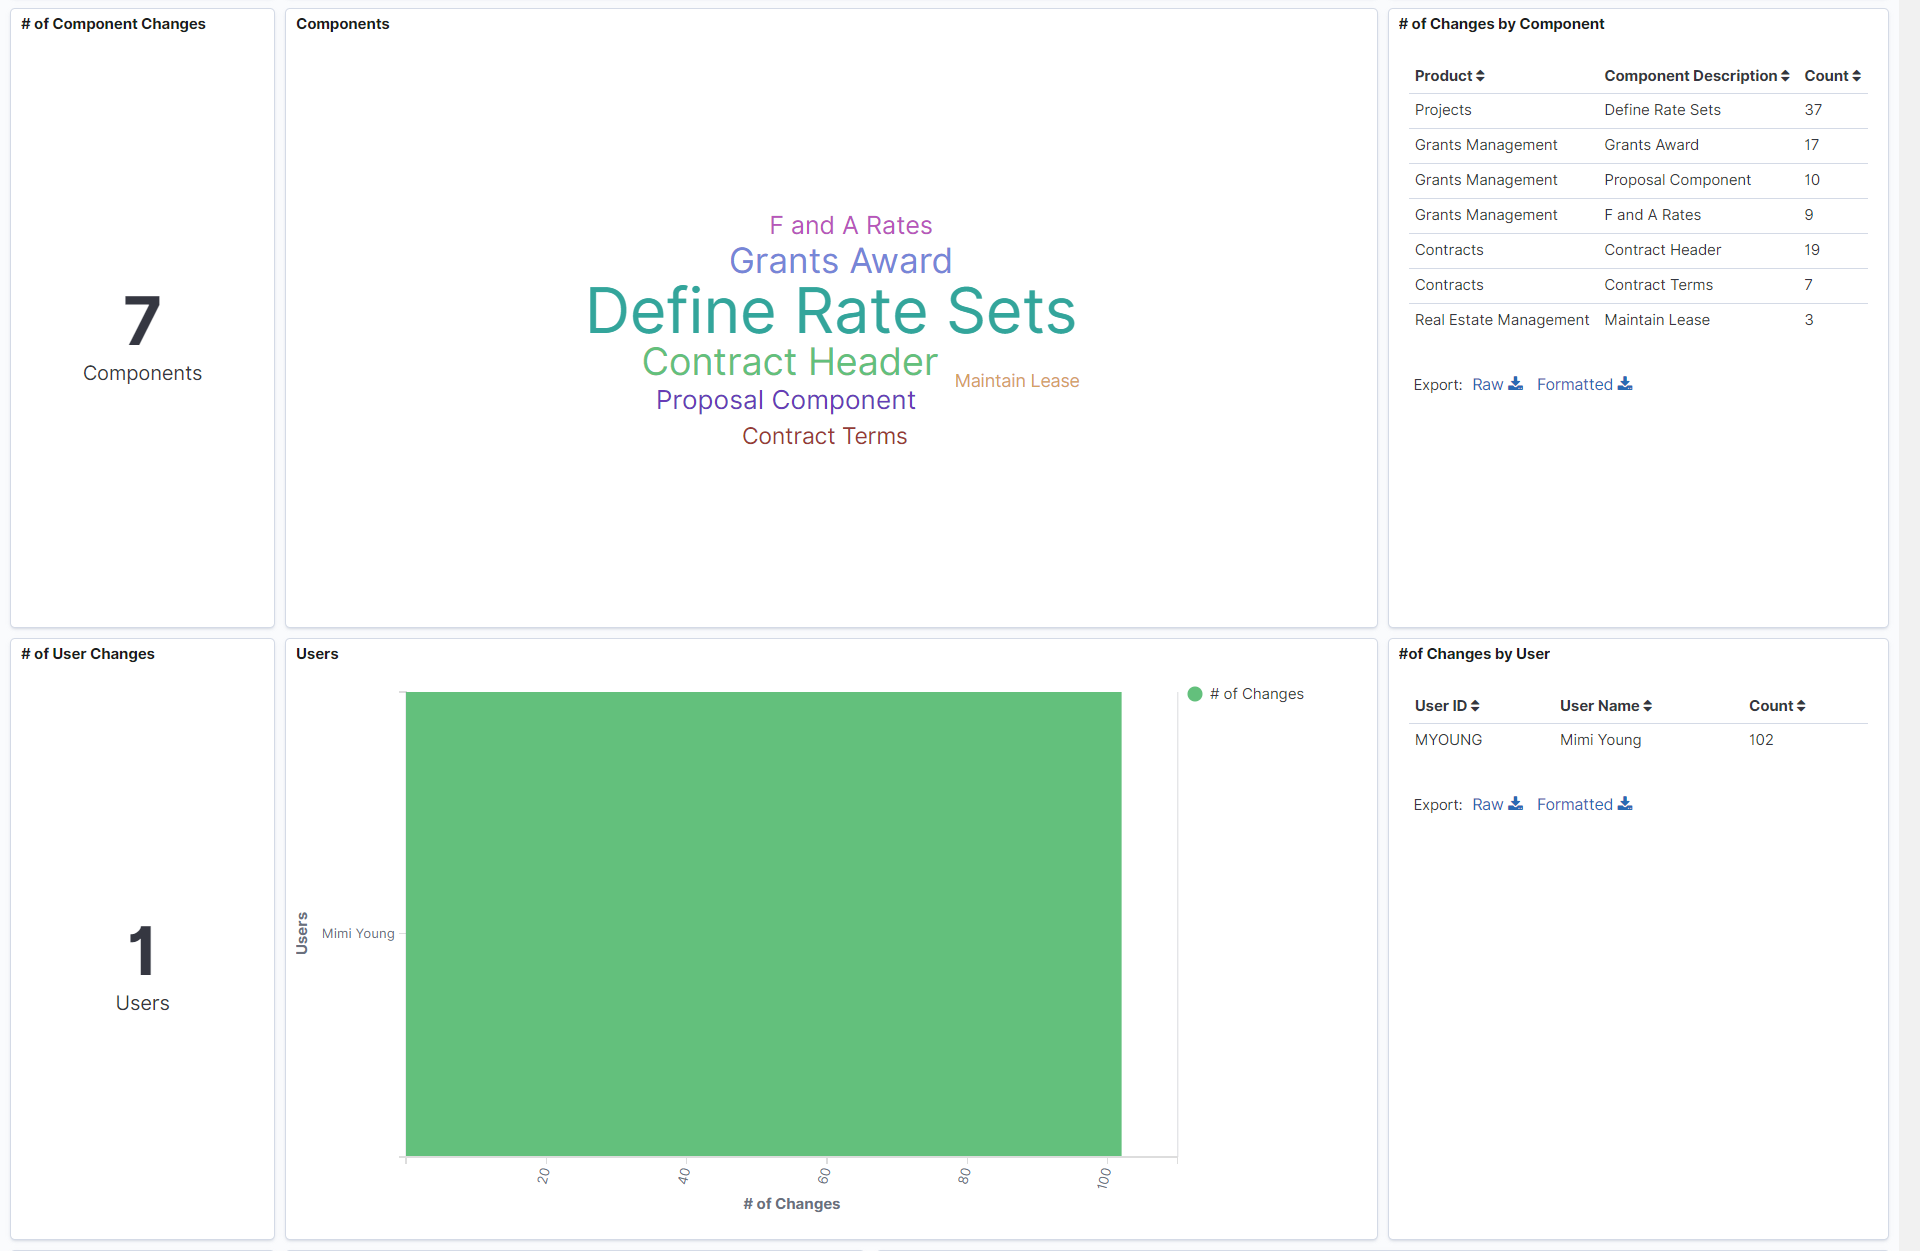
This example illustrates the fields and controls on the Change Tracking Analytics page (2 of 3). You can find definitions for the fields and controls later on this page.
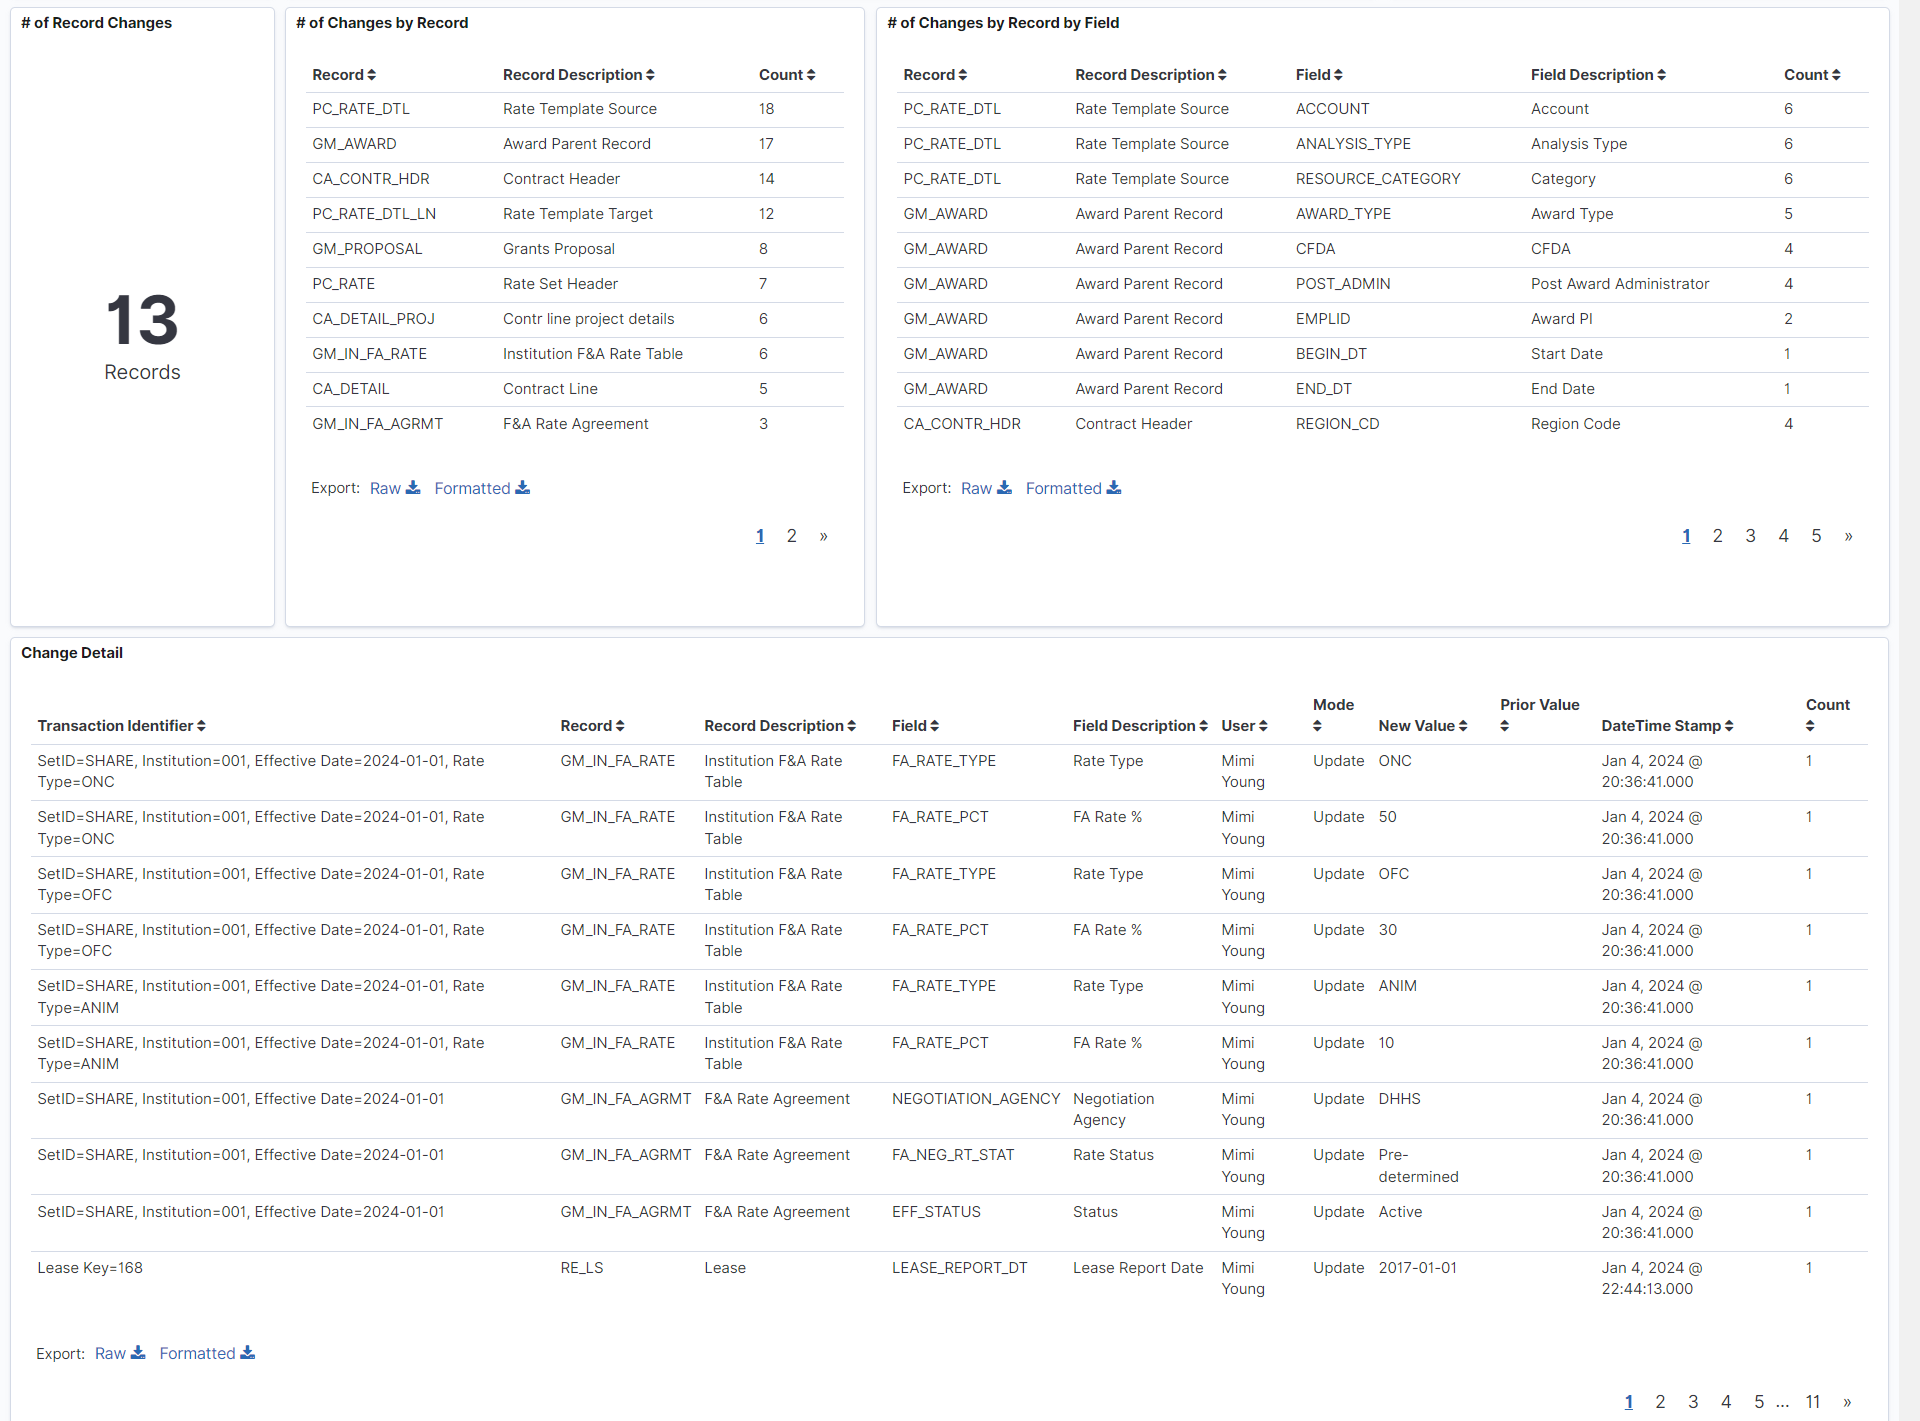
This example illustrates the fields and controls on the Change Tracking Analytics page (3 of 3). You can find definitions for the fields and controls later on this page.
|
Field or Control |
Description |
|---|---|
 |
Click to view a visualization in full-screen mode. You can see this icon when you hover over a visualization. |
 |
Select to make changes to the current filter criteria. |
 |
Click to select the required time period. The dashboards display data according to the date range specified. |
You can filter the data by entering relevant search text in the search field or by specifying additional filter criteria. You can also filter the data by clicking a product, component, or user name. The filters modify the data across all visualizations. The data table below the visualizations displays the transaction details that match the specified filter criteria. You can download the data as a CSV file.
Visualizations that are part of this dashboard are:
Changes by Product - This visualization row displays the total number of products and their names for which changes are made. It also displays the number of changes for each product in grid format.
Changes by Component - This visualization row displays the total number of components and their names for which changes are made. It also displays the number of changes for each component and their respective product names in grid format.
Changes by User - This visualization row displays the total number of users who made the changes. The User graph displays the comparison of users and the number of changes made by the users. It also displays the user ID, user name, and number of changes made by the users in grid format.
Changes by Record - This row displays the number of records for which changes are made. The name of the record, description of the record, and number of changes made to the record are displayed in grid format. The field names of the records for which changes are made, along with the change count, are also displayed in the Changes by Record by Field grid.
The Change Details grid lists all the change transactions with transaction identifier, record and field name and description, who made the change, type of change, date and time, and the field values before and after the change. Transaction Identifier shows the key values of the record that was changed.