Charting Financial Data
When using Asset Management charting features, you select your criteria and view the resulting online chart output.
|
Page Name |
Definition Name |
Usage |
|---|---|---|
|
AMCHART1 |
Select criteria and create and view online charts of financial data. |
Use the Selection Criteria page (AMCHART1) to select criteria and create and view online charts of financial data.
Navigation:
This example illustrates the fields and controls on the Selection Criteria page. You can find definitions for the fields and controls later on this page.
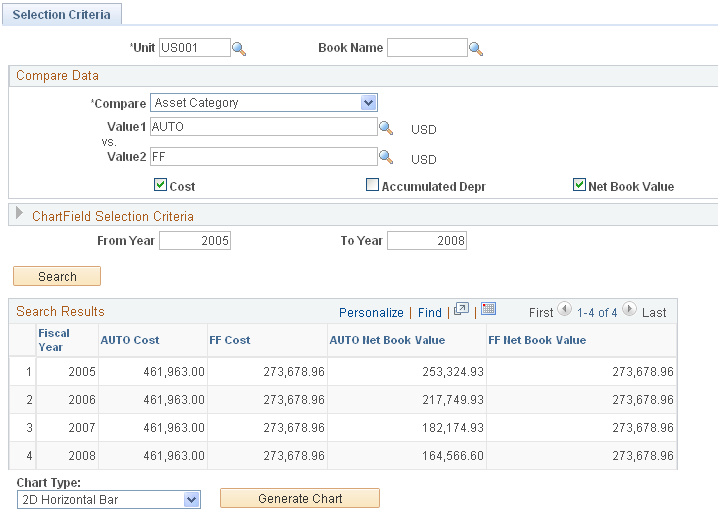
The Selection Criteria page defines the parameters for the chart. Values are derived to compare business units, books, ChartFields, and totals for cost, accumulated depreciation, and net book value, and are depicted in the resulting chart.
Compare Data
Field or Control |
Description |
|---|---|
Compare |
Select the values you want to compare in the chart. For example, if business unit is selected, you must select the business units to compare. The chart depicts the comparison between the business unit values that you enter. |
Cost, Accumulated Depr (accumulated depreciation), Net Book Value |
Select the summary totals to be compared. For example, to create a what-if scenario of business units for Germany and France operations, select Accumulated Depr to compare that value for each business unit. You must select at least one summary total to compare or any combination of the three. Note: When using reporting functions that report multiple currencies, the comparison is always reported in the frombusiness unit currency. |
ChartField Selection Criteria |
Further define the chart to display subtotals by ChartField. |
From Year and To Year |
Enter the range of fiscal years to include in the chart. |
Chart Type |
Select the type of chart you want to assemble. The valid choices are 2-D Horizontal Bar or Stacked Bar. |
When you have selected all the appropriate criteria, gather the data by clicking the Searchbutton. The data summary totals display, with one row for each fiscal year requested and one column for each field and value selected. Before you can view the chart, you must press the Generate Chart button.
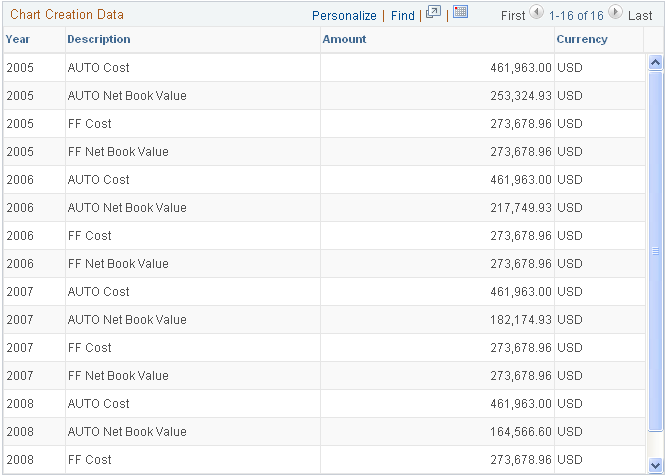
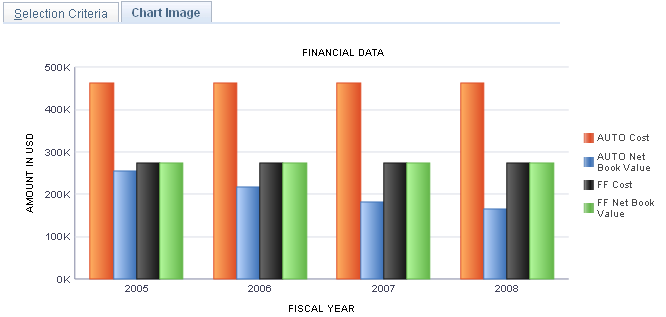
The chart image displays automatically on a second page tab. A legend is included in the chart for each color-coded bar in the chart. A summary of the chart totals displays in the Chart Creation Data group box.
This illustration depicts a summary of the chart totals:
This example illustrates the fields and controls on the Example: Chart Image page. You can find definitions for the fields and controls later on this page.
This example illustrates the fields and controls on the Example: Chart Summary Totals. You can find definitions for the fields and controls later on this page.