Viewing Earned Value
|
Page Name |
Definition Name |
Usage |
|---|---|---|
|
PC_EA_EARNED_VALUE |
View earned value and other data that is related to time factors, budget, and actual cost of a project and its activities. |
|
|
PC_EARNED_VAL_PRJN |
View earned value history and future projection for projects or activities in an S-Curve chart. |
|
|
PC_PRCNT_COMP_HIST |
View a chart of the percent complete progression over time for projects and activities. |
|
|
PC_ACT_FCAST_CHART |
View a bar chart of the actual cost of work performed values and the forecast values for projects and activities. |
Earned value is a way to monitor the activity budget by comparing the amount of work that is performed against the amount that is budgeted for that quantity of work. For example, if half of the work that is required by an activity is completed, only half of the activity's budget should be used.
Use the Earned Value page (PC_EA_EARNED_VALUE) to view earned value and other data that is related to time factors, budget, and actual cost of a project and its activities.
Navigation:
This example illustrates the fields and controls on the Earned Value page. You can find definitions for the fields and controls later on this page.
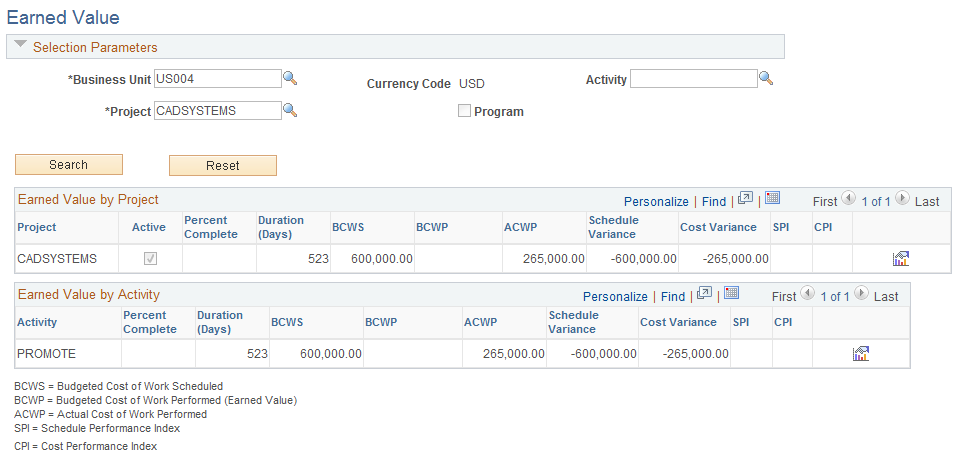
Enter the necessary search criteria to filter the projects or activities that require earned value analysis. Click the Search button to retrieve and display a list of projects and activities that meet the specified parameters. Click the Reset button to reinstate the default search settings.
If a detail project is entered in the Project field, the page displays earned value data for the entire project and for each activity that is within the project.
If a program is entered in the Project field, the page displays earned value data for all projects that are under the specified program. The Max Level field limits the selection of child projects to the first, second, or third level under the program as it is defined on the enterprise program tree.
Field or Control |
Description |
|---|---|
Percent Complete |
Displays the percentage complete value that the system calculates based on the method that is selected on the Project Costing Definition page. |
Duration (Days) |
Displays the number of days that are allotted for the completion of the project or activity. |
BCWS (budgeted cost of work scheduled) |
Displays the budget amount that is allocated for the time period starting from the beginning of the project or activity to the current date. |
BCWP (budgeted cost of the work performed) |
Displays the budgeted cost based on the percentage of the project or activity that is completed and the corresponding duration date. For example, if the project is 50 percent complete, this field summarizes and displays all budget rows in the Project Transactions summary table (PC_SUMMARY_TBL) that have an accounting date that occurs on or before the halfway date of the project's duration. This is also known as the earned value. |
ACWP (actual cost of work performed) |
Displays the actual cost of the project or activity as of the current date. |
Schedule Variance |
Displays the cost difference between the baseline plan and the current progress of the activity at the current date. Calculated as: (Budgeted Cost of Work Performed) − (Budgeted Cost of Work Scheduled) . |
Cost Variance |
Displays the difference between how much it should cost to achieve the current level of completion for the activity and how much it actually costs to a achieve the level of completion as of the current date. Cost variance is calculated as (Budgeted Cost of Work Performed) − (Actual Cost of Work Performed) . |
SPI (schedule performance index) |
Displays the ratio of the work that is performed to the work that is scheduled, which is calculated as (Budgeted Cost of Work Performed) ÷ (Budgeted Cost of Work Scheduled) . |
CPI (cost performance index) |
Displays the ratio of the budgeted cost of work that is performed to actual cost, which is calculated as (Budgeted Cost of Work Performed) ÷ (Actual Cost of Work Performed) . |
|
Click to access the Earned Value Projection page where you can view earned value history and future projection. If you click the icon on an activity row, the system draws the chart for that activity. If you click the icon on a project row, the system draws the chart for that project. |

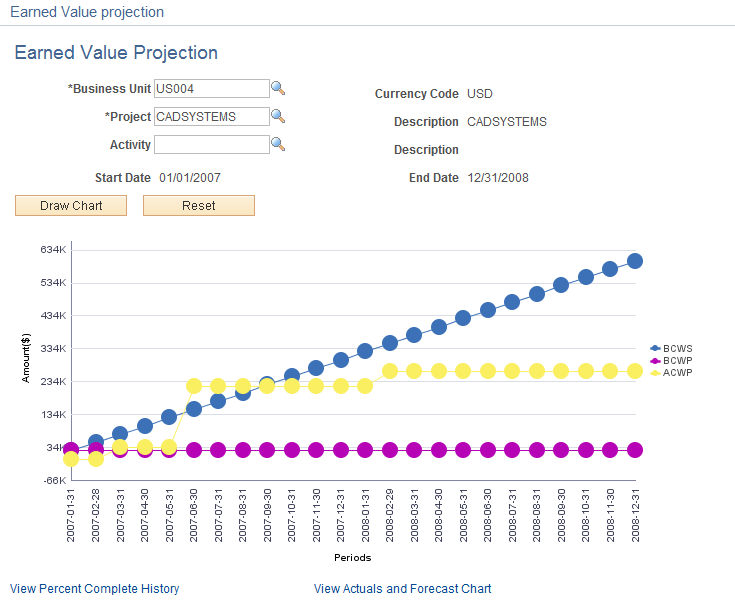
Use the Earned Value Projection page (PC_EARNED_VAL_PRJN) to view earned value history and future projection for projects or activities in an S-Curve chart.
Navigation:
.
. Click the View Earned Value Projection icon.
. Select Go To: Earned Value Projection.
. Select Go To: Earned Value Projection.
. Click the View Earned Value Projection icon.
Note: Because earned value reporting is a comparison of the performance of a project against its budget, if a project does not have an active budget, earned value cannot be determined. The system can draw the earned value projection chart only for projects with active budgets.
This example illustrates the fields and controls on the Earned Value Projection page. You can find definitions for the fields and controls later on this page.
Field or Control |
Description |
|---|---|
Business Unit |
Enter the business unit that contains the project or activity for which you want to draw the chart. |
Project |
Enter the project ID for which you want to draw a chart. If you want to draw a chart for a project, you should leave the Activity field blank. |
Activity |
Enter the activity for which you want to draw a chart. If you leave this field blank, the system draws a chart at the project level. |
Currency Code |
Displays the currency code in which the amounts are displayed. This is the project business unit currency code. |
Start Date and End Date |
Displays the start date and end date of either the project or the activity depending on whether the chart is being drawn for a project or for an activity. |
Draw Chart |
Click to render the chart based on the parameters that you entered for Business Unit, Project, and Activity. |
Reset |
Click to reset the chart to the original chart from when you entered this page. |
Periods |
Displays the periods that are based on the active project cost budget calendar. Each plot point represents the ending date of each budget period. The last plot point is based on the budget period end date of the greatest accounting date of actuals, cost estimates to complete, and budget for the project. If the project does not have an active budget, then the system cannot determine earned value and an error message appears. |
BCWS (budgeted cost of work scheduled) |
Represents the budgeted cost of work scheduled. This is the finalized budget. The system uses the Cost Budget analysis group defined for the project and sums all amounts with accounting dates less than or equal to each plot point date. |
BCWP (budgeted cost of work performed) |
Represents the budget cost of work performed. The system charts the BCWP values based on these rules:
|
ACWP (actual cost of work performed) |
Represents the actual cost of work performed. The system charts the ACWP values based on these rules:
|
View Percent Complete History |
Click to access the Percent Complete History page where you can view the percent complete progression for this project or activity. |
View Actuals and Forecast Chart |
Click to access the Actual and Forecast Chart page where you can view actuals and forecast over time for this project or activity. |
Use the Percent Complete History page (PC_PRCNT_COMP_HIST) to view a chart of the percent complete progression over time for projects and activities.
Navigation:
.
. Click the View Percent Complete History link.
This example illustrates the fields and controls on the Percent Complete History page. You can find definitions for the fields and controls later on this page.
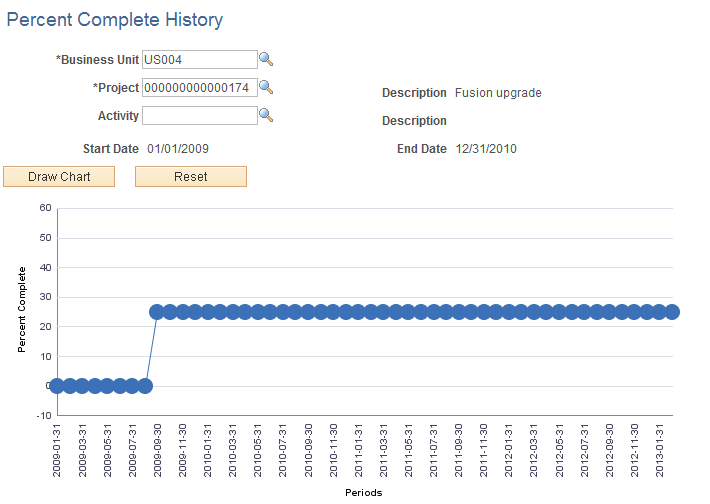
If you access this page by clicking on the View Percent Complete History link from the Earned Value Projection page, the system opens this page in a new window and displays the chart with the criteria that you entered on the Earned Value Projection page. If you access this page from menu navigation, you can enter the search criteria and click the Draw Chart button to generate the chart.
The system draws the chart from the project or activity start date to the current date. The x-axis is based on the project's active budget calendar. If the project has no active budget, then the installation level default budget calendar will be used. The plot points are the budget period end dates. The y-axis is the percent complete.
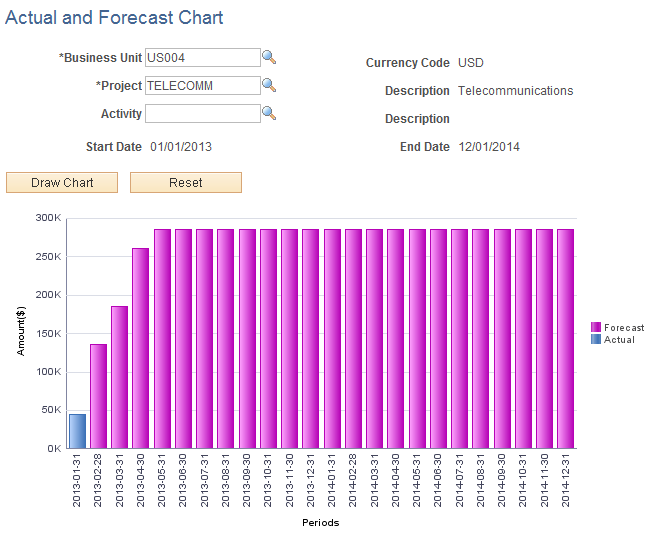
Use the Actual and Forecast Chart page ( PC_ACT_FCAST_CHART ) to view a bar chart of the actual cost of work performed values and the forecast values for projects and activities.
Navigation:
.
. Click the View Actuals and Forecast Chart link.
This example illustrates the fields and controls on the Actual and Forecast Chart page. You can find definitions for the fields and controls later on this page.
This example illustrates the fields and controls on the Actual and Forecast Chart page. You can find definitions for the fields and controls later on this page.
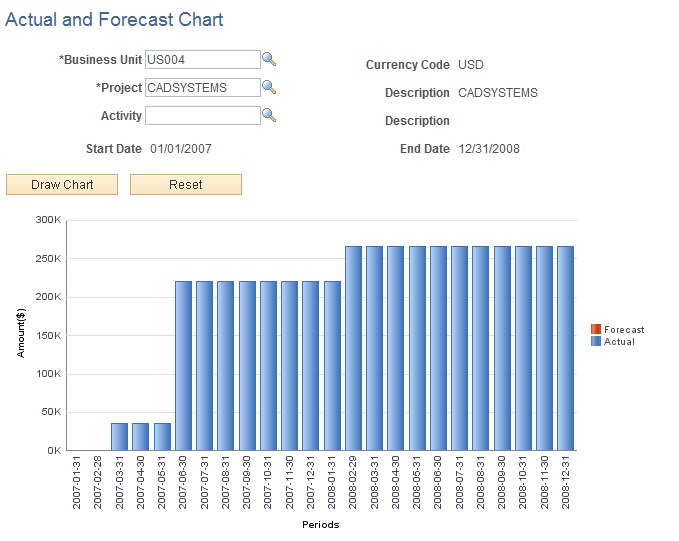
This page displays a bar chart of the ACWP for each period. If you access this page by clicking on the View Actuals and Forecast Chart link from the Earned Value Projection page, the system opens this page in a new window and displays the chart with the criteria that you entered on the Earned Value Projection page. If you access this page from menu navigation, you can enter the search criteria and click the Draw Chart button to generate the chart.