Viewing Forecast to Complete Variance
Note: The forecasts mentioned on this page refer to only Services Forecasting forecasts, not to the Estimate at Completion forecasts.
|
Page Name |
Definition Name |
Usage |
|---|---|---|
|
BUS_UNIT_TBL_PC |
To use this analytic function, select a value for the Hours Unit of Measure field. This value converts the quantity of the selected unit of measure to hours. |
|
|
PC_EA_ETC_ANL1 |
Provides project search criteria to display a list of project transactions with time and date variance data. |
|
|
PC_EA_ETC_ANL2 |
Uses search criteria from Forecast to Complete Variance page to display graphical view of project time and date variance data. |
Use the Forecast to Complete Variance page (PC_EA_ETC_ANL1) to provides project search criteria to display a list of project transactions with time and date variance data.
Navigation:
Note: This page reports only projects for which the forecasting level is set to Project/Activity on the Program Management page.
This example illustrates the fields and controls on the Forecast to Complete Variance page. You can find definitions for the fields and controls later on this page.
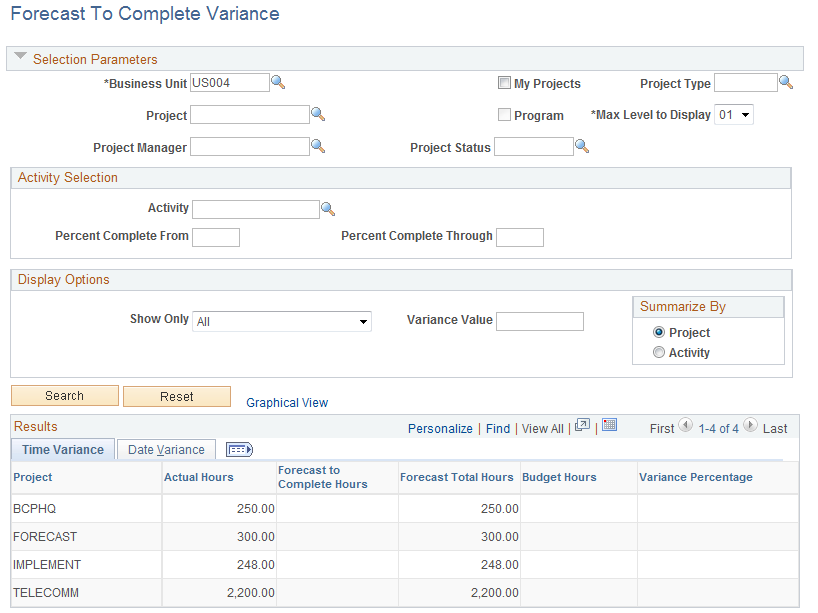
Enter the necessary search criteria to filter the projects that require forecast to complete variance analysis. Click the Search button to retrieve and display a list of projects that meet the specified parameters. Click the Reset button to reinstate the default search settings.
The page displays time and date variance data for each project that is in the filtered list.
Click the Graphical View link to create a chart view of the variance data. This link is only available if the selected Summarize By option is Project.
Activity Selection
Field or Control |
Description |
|---|---|
Activity, Percent Complete From, and Percent Complete Through |
Select an activity ID for which the completion percentage ranges from the value in the Percent Complete From field through the value in the Percent Complete Through field to provide further search criteria. |
Display Options
These options customize how variance data appears.
Field or Control |
Description |
|---|---|
Show Only |
Select a value other than the default All to limit the displayed variances by using a comparison variance value. Options are:
|
Variance Value |
Specify the variance value to use for comparison purposes. |
Summarize By |
Select whether variance data displays by Project or by Activity. |
Time Variance and Date Variance
Field or Control |
Description |
|---|---|
Activity |
Displays the activity ID. This column is displayed only if Activity is selected in the Summarize By section. |
Actual Hours |
Displays the number of hours that are recorded for the project or activity. |
Forecast to Complete Hours |
Displays the number of forecasted hours to complete the project or activity from the forecasting tables FC_TIME_HDR and FC_TIME_DTL for the forecast horizon that was most recently completed. |
Forecast Total Hours |
Displays the sum of Actual Hours and Forecast to Complete Hours. |
Budget Hours |
Displays the total number of hours that are budgeted for the project or activity. |
Variance Percentage |
Displays the variance percentage, which is calculated as ((Forecast Total Hours) − (Budget Hours)) ÷ (Budget Hours) × 100 |
End Date |
Displays the activity or project end date. If the list is summarized by activity, this is the activity's end date. If the list is summarized by project, this is the project's end date. |
Forecast to Complete Date |
Displays the completion date estimate from the forecasting table FC_TIME_DTL for the forecast horizon that was most recently completed. |
Variance (Days) |
Displays the difference (in days) between the end date and estimate to complete date. Negative values indicate that completion is ahead of schedule and positive values indicate the number of days that the project is behind schedule. |
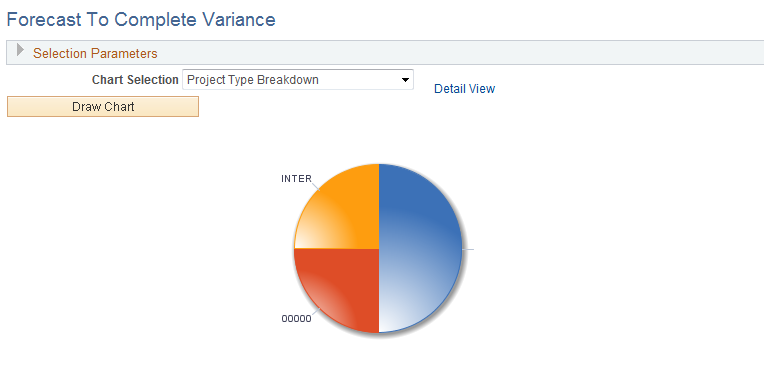
Use the Forecast to Complete Variance - Graphical View page (PC_EA_ETC_ANL2) to uses search criteria from Forecast to Complete Variance page to display graphical view of project time and date variance data.
Navigation:
Click the Graphical View link on the Forecast to Complete Variance page.
This example illustrates the fields and controls on the Forecast To Complete Variance - Graphical View page. You can find definitions for the fields and controls later on this page.
Field or Control |
Description |
|---|---|
Chart Selection |
Select one of the following chart options and click the Draw Chart button to display the chart. % Variance Hours by Project: Displays a bar chart of budget versus forecast hours percent variance. Project Status Breakdown: Displays a pie chart of projects classified by status. Project Type Breakdown: Displays a pie chart of projects classified by type. Variance Days by Project: Displays a bar chart of estimate to complete date variance. |
Detail View |
Click this link to access the Forecast To Complete Variance page, which displays the list of projects and corresponding variance data that are charted. |