Analyzing Lease Administration Using PeopleSoft Insights
This topic displays and explains how to analyze Lease Administration data using PeopleSoft Insights dashboards.
|
Page Name |
Definition Name |
Usage |
|---|---|---|
|
EP_RE_PAYMENT_INS |
Analyze lease payments, including obligation reduction and interest expense, and lease expirations. |
|
|
EP_RE_PAYMENT_INS |
Analyze forecasted lease payments and obligation reduction between two dates, including totals by fiscal year for disclosure reporting. |
Use the Lease Payment Insights dashboard to analyze an overview of the payable lease portfolio by providing valuable insights into payable lease payments and lease expirations.
The filters for this dashboard are included in the below table. Amounts will be displayed in the Business Unit’s base currency.
Navigation:
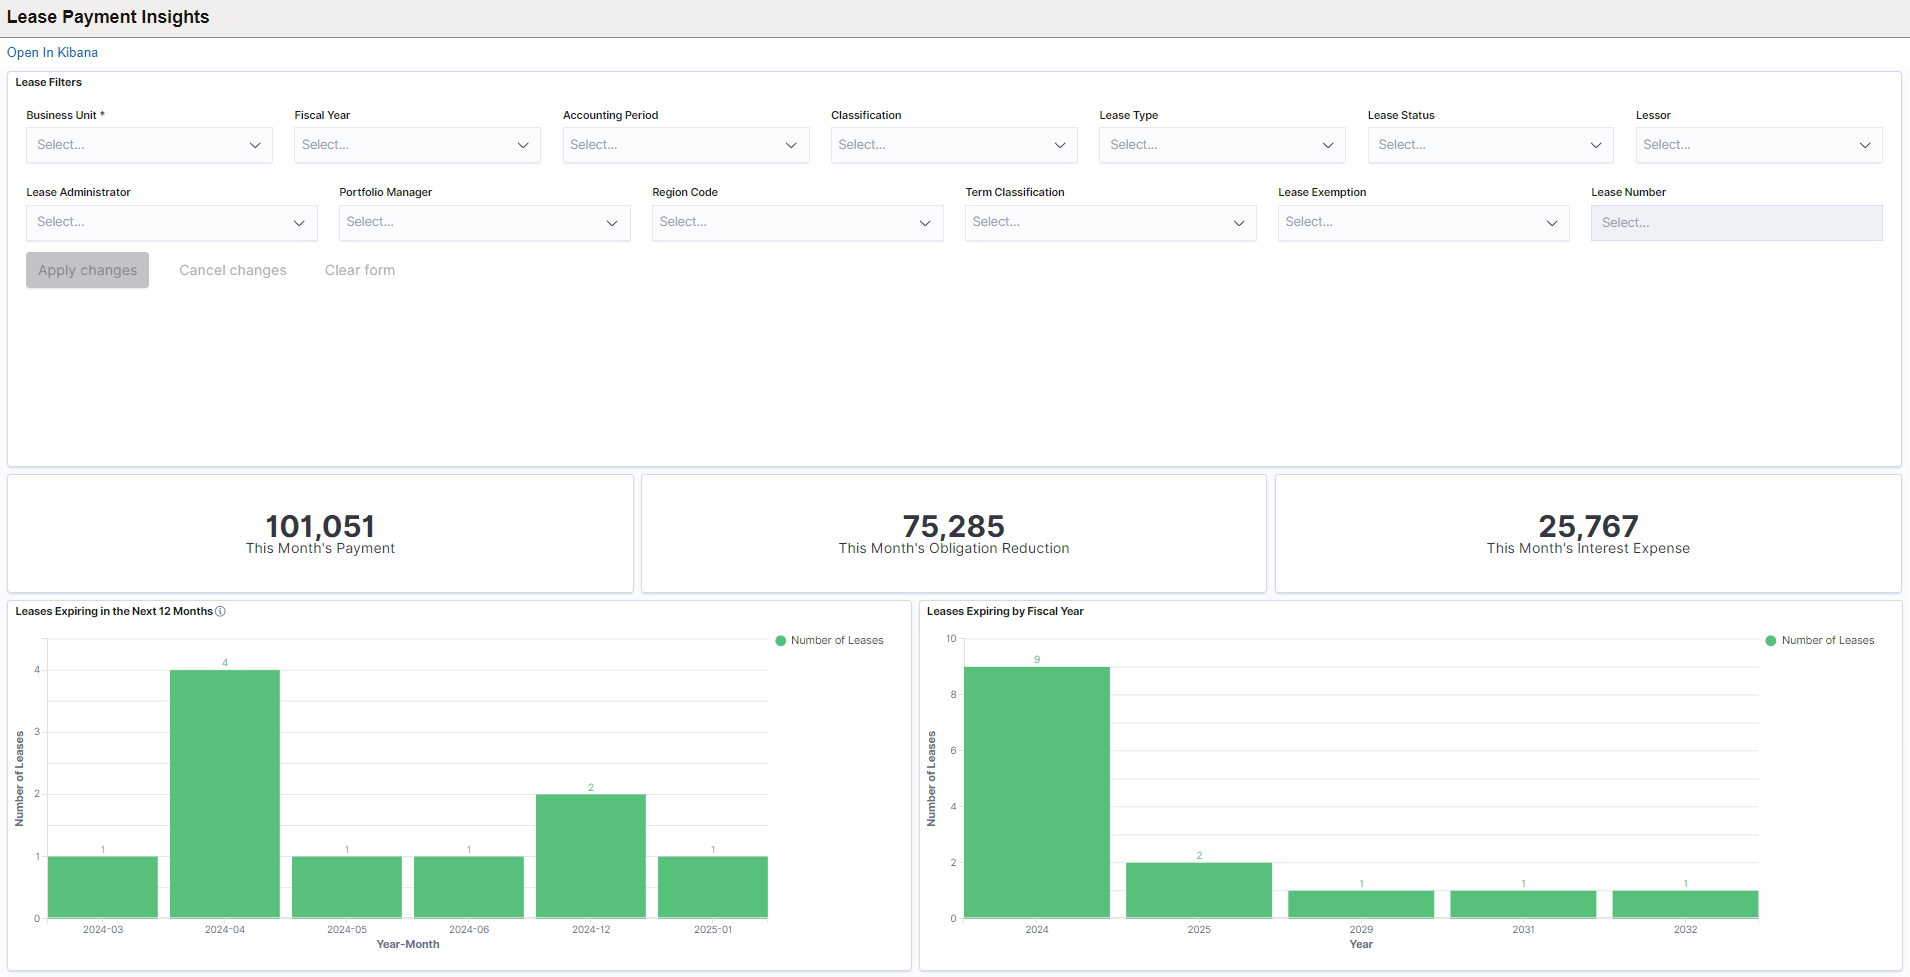
This example illustrates the fields and controls on the Lease Payment Insights Dashboard (1 of 2)
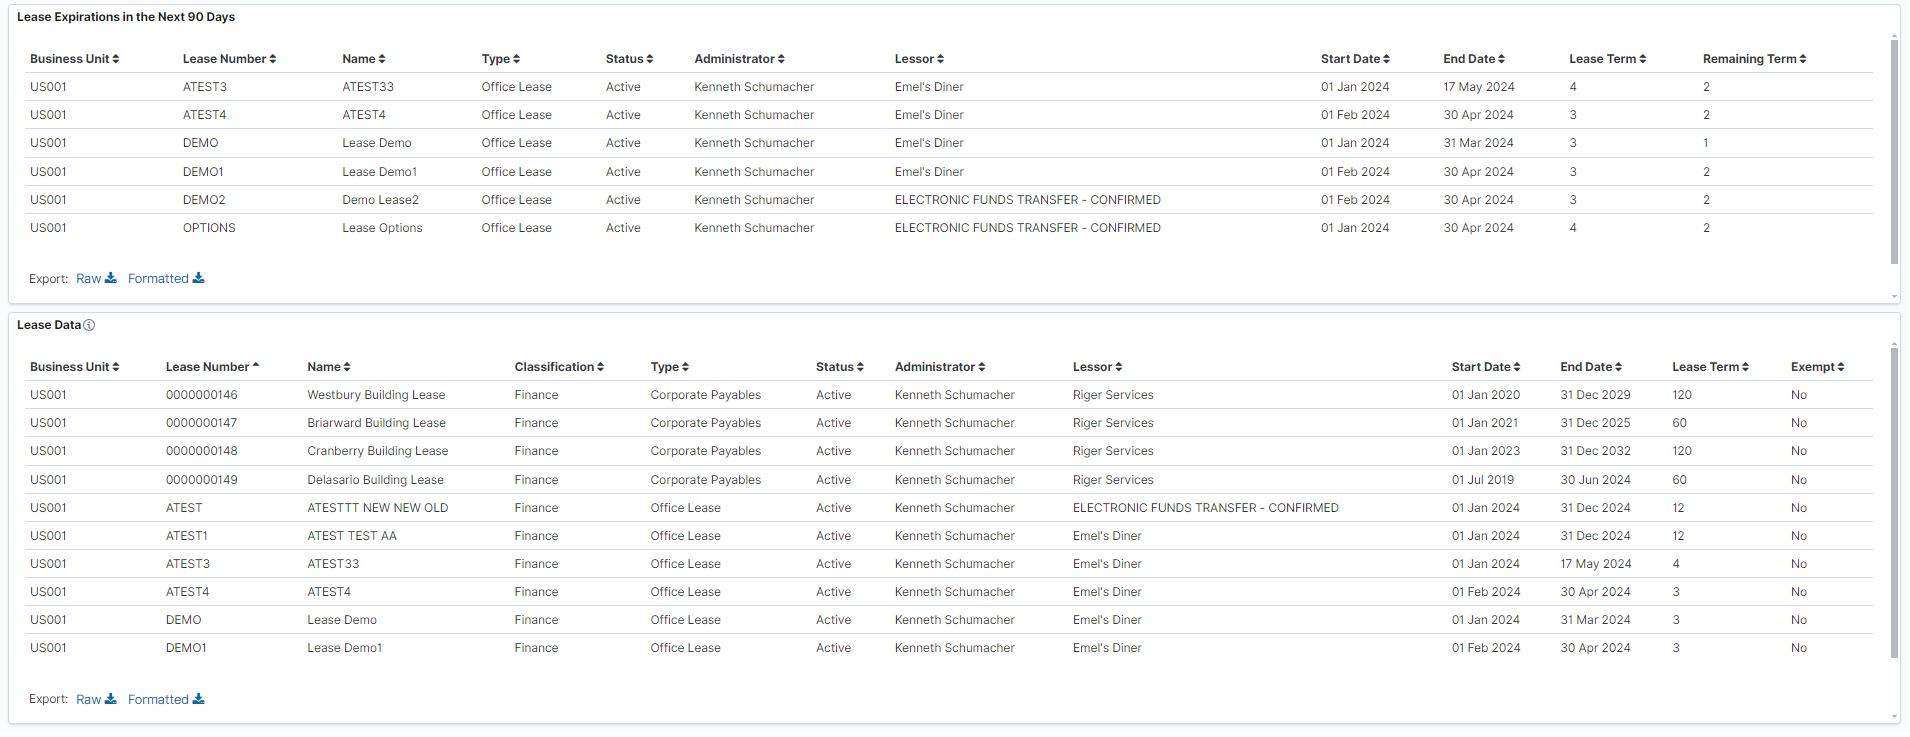
This example illustrates the fields and controls on the Lease Payment Insights Dashboard (2 of 2)
The visualizations and data displayed on the Lease Payment Insights dashboard are based on values selected for the Business Unit, Fiscal Year, and Accounting Period filters, which are required.
You can further filter visualizations and data based on additional delivered filters, such as Lessor, Lease Type, Lease Status, and more.
Data can also be filtered by selecting any categorical data within a visualization (for example, an individual bar in a bar graph).
The following visualizations are part of this dashboard:
This Month’s Payment: Provides total payment amount for current month of all filtered leases.
This Month’s Obligation Reduction: Provides the total obligation reduction amount for the current month of all filtered leases.
This Month’s Interest Expense: Provides the interest expenses amount for the current month of all filtered leases.
Lease Expiring in the Next 12 Months: Provides the number of leases expiring in the next 12 months period for all filtered leases.
Lease Expiring by Fiscal Year: Provides the number of leases expiring in each fiscal year for all filtered leases.
Lease Expirations in the Next 90 Days: Displays a detailed list of leases expiring in the next 90 days for all filtered leases. The list includes the start and end dates, total lease term, and the remaining term to expiry.
Lease Data: Displays a detailed list of filtered leases making up the data shown in the visualizations.
Each visualization can be viewed separately in full screen. You can also drill down for more information using the Inspect option. That data can be downloaded as a comma separated value (CSV) file.
Use the Lease Payment Forecast dashboard to forecast lease payments and lease obligation reductions annually.
Navigation:
This example illustrates the fields and controls on the Lease Payment Forecast Dashboard.
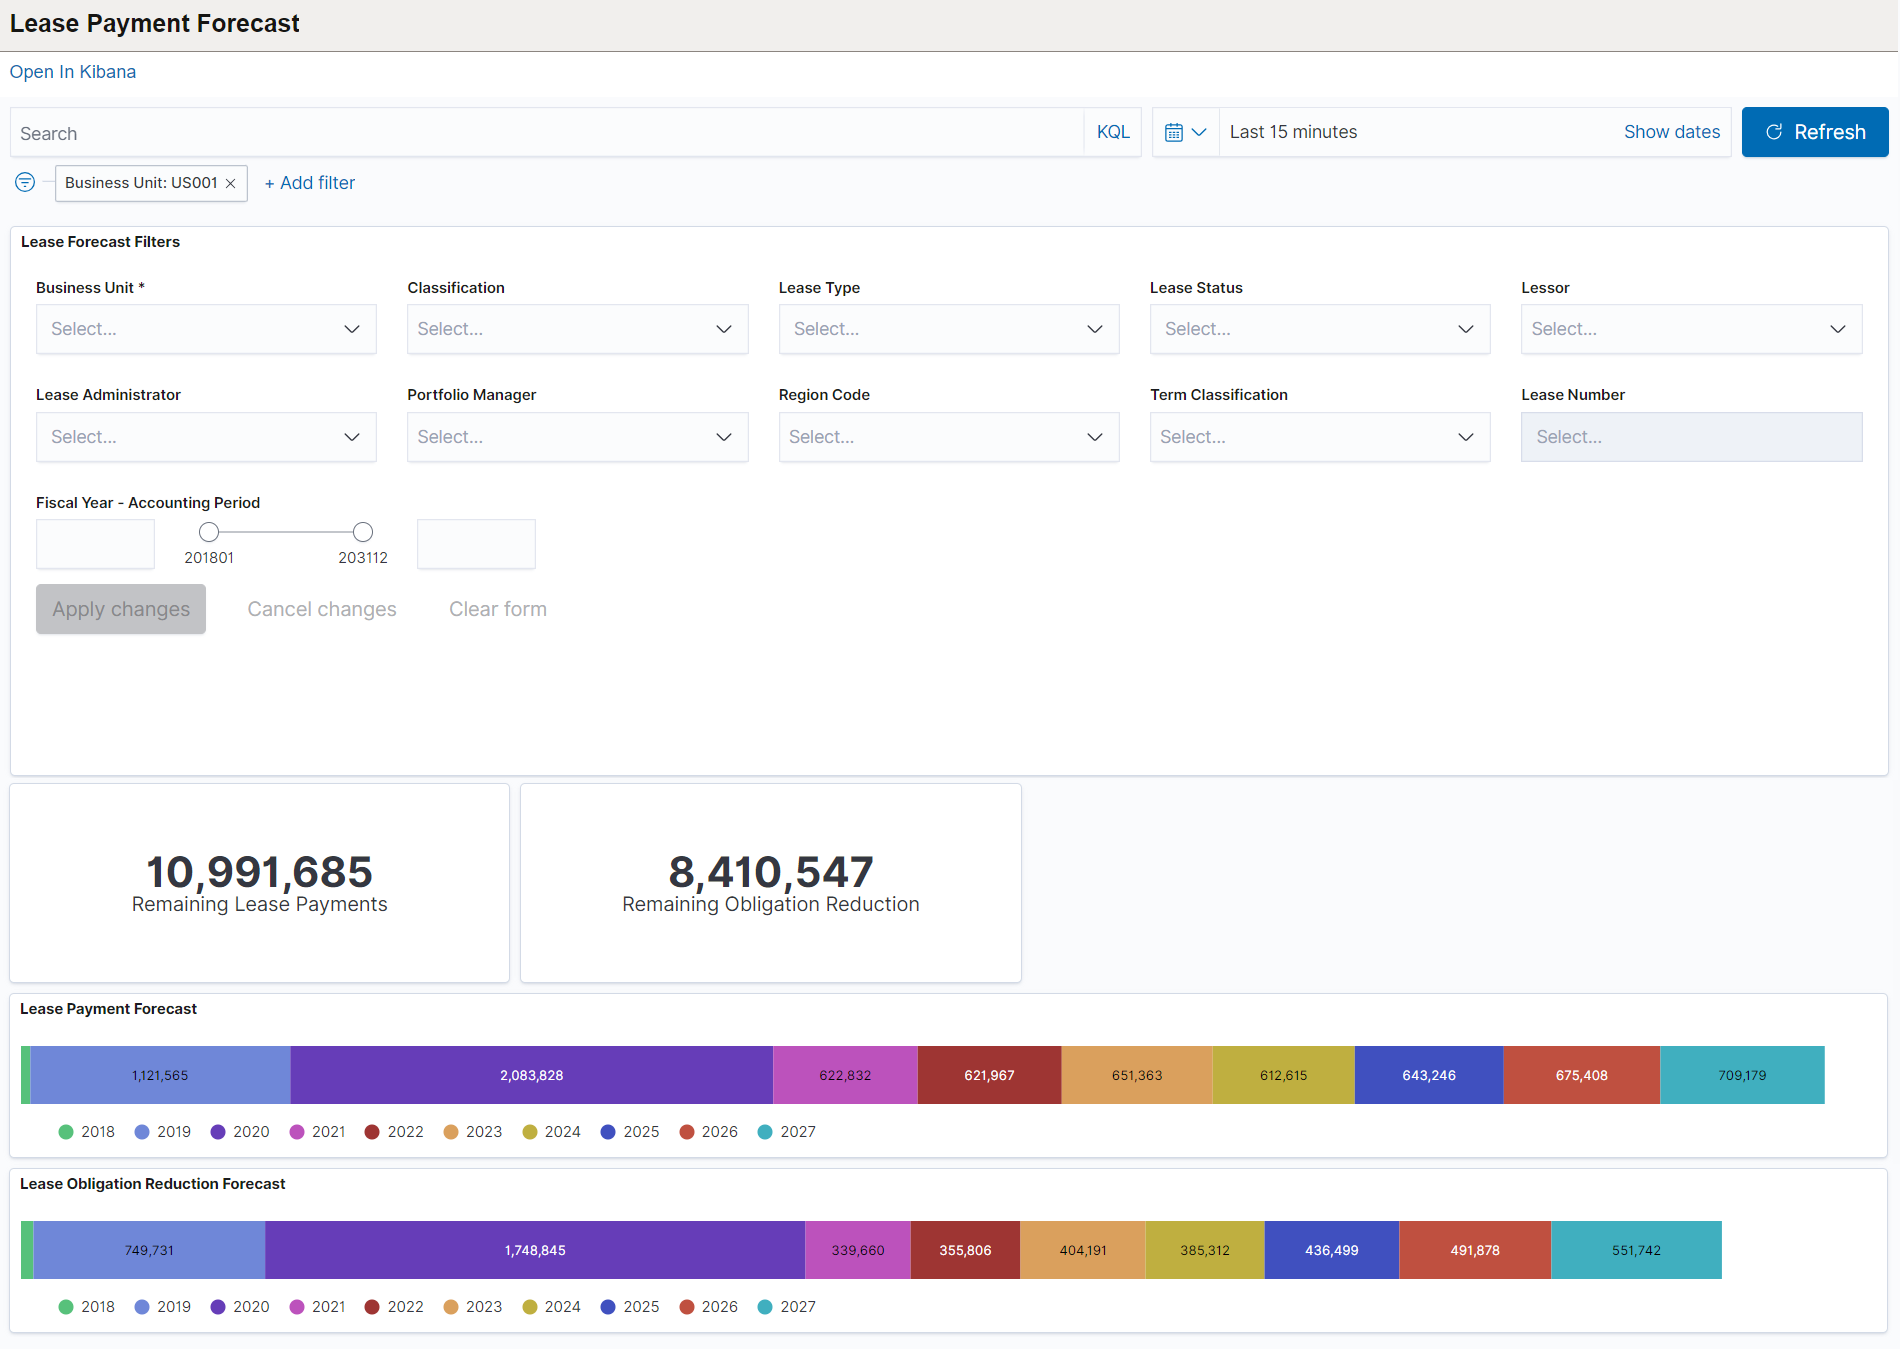
The visualizations and data displayed on the Lease Payment Forecast dashboard are based on the required filters selected for the Business Unit and between two Fiscal Years/Accounting Periods.
You can further filter visualizations and data based on additional delivered filters, such as Lease Type, Lease Status, Lessor, and more.
Data can also be filtered by selecting any categorical data within a visualization (for example, an individual bar in a bar graph).
The following visualizations are part of this dashboard:
Remaining Lease Payments: Provides the total amount of remaining lease payments for the filtered leases.
Remaining Obligation Reduction: Provides the total amount of remaining obligation reduction for the filtered leases.
Lease Payment Forecast: Provides the year-by-year lease payment amounts between the selected periods for the filtered leases.
Lease Obligation Reduction Forecast: Provides the year-by-year obligation reduction amounts between the selected periods for the filtered leases.
Each visualization can be viewed separately in full screen. You can also drill down for more information using the Inspect option. That data can be downloaded as a CSV file.