Conducting Consolidated Scenario Analysis
This topic provides an overview of consolidated scenario analysis.
|
Page Name |
Definition Name |
Usage |
|---|---|---|
|
Consolidated Scenario Analysis - Scenario Summary (approve) Page |
RS_SCENARIO_SUMM |
View supply summaries and supply and demand metrics with graphical comparison. This page is for users that have security permission to create, save, and approve consolidated scenarios. Permission list EPRS9400 grants users the authority to approve consolidated scenarios, but not to unapprove them. |
|
Consolidated Scenario Analysis - Scenario Summary (approve and unapprove) Page |
RS_SNR_UNAPPROVE |
Users with the appropriate security permission can use this page to unapprove a scenario. This page is for users with security permission to create, save, approve, and unapprove consolidated scenarios. Permission list EPRS9500 grants users the authority to approve and unapprove consolidated scenarios. Consolidated Scenario Analysis - Scenario Summary (approve) Page |
|
RS_SCENARIO_DTL |
Commit or defer the demand for a particular scenario. |
|
|
RS_SNR_DEMAND_DTL |
Adjust forecasted and allocated demand and modify project header information. |
|
|
Consolidated Scenario Analysis - Assumptions Consolidated Scenario Analysis - Scenario Summary (approve) Page |
RS_SCENARIO_ASSUMP |
After you approve the scenario, enter assumptions that assisted in approving the scenario. The Approve button is available only if the scenario is in a pending status. |
|
RS_ADD_ROLE_DMD |
Enter the role SetID, role, forecasted demand, and allocated demand information to create a new role for the demand. |
|
|
RS_SNR_SUPPLY |
Modified the supply forecast and view over-allocated roles. |
|
|
Consolidated Scenario Analysis - Edit Supply By Region Page |
RS_SNR_EDIT_REGION |
Modify a role's forecasted supply by region. |
|
Consolidated Scenario Analysis Page |
RS_CON_ACE_PAGE |
Analyze consolidated scenario data by supply categories by month. Consolidated Scenario Analysis - Scenario Summary (approve) Page |
The consolidated scenario analysis is the final of three primary components in the Capacity Planning process flow. When you begin the capacity planning process, you can choose to build the supply or demand forecasts in any order. Supply and demand forecasts are typically built by different users. Both forecasts must be completed and available prior to performing the consolidated scenario analysis.
The currency code determines how the consolidated scenario displays estimated cost information. For example, if you select USD and the role rates by region are in another currency, the system converts the currency to USD during the calculation of the blended rate, so that estimated costs for supply and demand can be shown in USD.
Note: If the same forecast is included in more than one scenario prior to either forecast being approved, as soon as one of the scenarios is approved, both forecasts are locked. The unapproved forecast can no longer be approved and will have a status of Obsolete.
By using a consolidated scenario analysis, you can:
View graphs of the combined supply-demand forecasts.
Project the amount of demand to which your organization can realistically commit based on the supply constraints.
Perform further modification of supply and demand forecasts to model what-if scenarios.
Approve a consolidated scenario and track assumptions that are integral to the scenario's approval.
Use the Combined Scenario component (RS_SCENARIO) to conduct a consolidated scenario analysis.
Use the Consolidated Scenario Analysis - Scenario Summary (approve) page (RS_SCENARIO_SUMM) to View supply summaries and supply and demand metrics with graphical comparison.
Navigation:
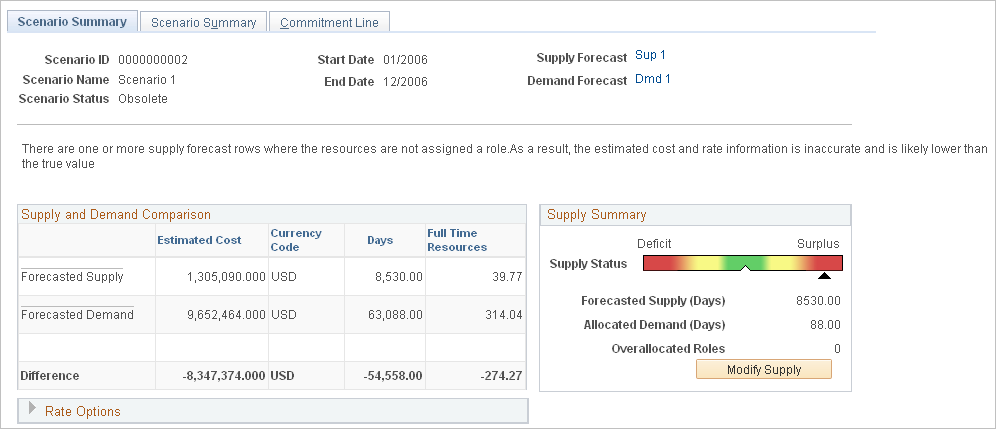
This example illustrates the fields and controls on the Consolidated Scenario Analysis - Scenario Summary page (1 of 2). You can find definitions for the fields and controls later on this page.
This example illustrates the fields and controls on the Consolidated Scenario Analysis - Scenario Summary page (2 of 2). You can find definitions for the fields and controls later on this page.
Field or Control |
Description |
|---|---|
Scenario ID |
Displays the scenario that was either auto-generated or manually assigned when the scenario was created. |
Scenario Status |
Displays the scenario status which can be Pending, Approved, or Obsolete. A scenario starts in a pending status until it is approved. A scenario can become obsolete if another scenario using either the same supply or demand forecast has already been approved. |
Start Date and End Date |
Displays the start and end dates from the supply and demand forecasts you selected for this scenario. |
Supply Forecast and Demand Forecast |
Displays the supply forecast and demand forecast for the consolidated scenario analysis. The date ranges for the supply and demand forecasts must be an exact match to be eligible for analysis. The initial supply and demand forecast prompts return only the supply or demand forecasts that are not approved on another scenario, because approving a scenario locks the scenario and the forecasts. |
Supply and Demand Comparison
The supply and demand metrics compare total forecasted supply against total forecasted demand for the selected forecasts.
Field or Control |
Description |
|---|---|
Estimated Cost |
For Forecasted Supply, the system calculates the cost of each resource by using the rate by role by region, including currency conversion. For Forecasted Demand, it is possible to have demand that calls for specific roles but does not specify region. To calculate estimated costs, the system initially uses the blended rate. The system calculates the blended rate by multiplying the role rate by region by the capacity for each supply forecast row, adding the results for each row, and dividing by the total capacity. The system multiplies the blended rate by the total demand hours to determine the forecast demand estimated cost. You can override the blended rate for a scenario. |
Days or Hours |
Displays the total number of days (or hours depending on setup) available in the selected supply and demand forecasts (includes all roles in the forecast). |
Full Time Resources |
Displays the number of full-time resources by category that are needed for the forecasted supply and forecasted demand. Note: To convert to full-time resources, the system uses the installation settings for the number of days per month and the total number of days in one month. The system calculates full-time resources for demand by using the region utilization percentage that is based on the default capacity planning region code that is specified on the Installation Options - Resource Management page. Full-time resources for supply are based on the full-time resources that are calculated in the supply forecast. |
Supply Summary
Field or Control |
Description |
|---|---|
Supply Status |
There are five possible statuses, indicated visually by the colored bar with the black triangular pointer:
|
Forecasted Supply |
Displays the total capacity of the selected supply forecast for all roles. |
Allocated Demand |
Displays the total committed effort from the Demand - Summary grid on the Consolidated Scenario Analysis - Commitment Line page. Note: When you enter a new scenario, the system sets all demand lines to Commit by default. You can change the Commit to Defer on each demand line as needed, thus reducing the total demand. |
Overallocated Roles |
Displays the number of roles that dropped below available supply. This is a sum of individuals based on the available roles in the supply forecast. |
Modify Supply |
Click to access the Consolidated Scenario Analysis - Supply Details page to modify the forecasted supply by role, and add new roles. |
Rate Options
Expand this group box to view the blended cost rate that the system calculates for the supply and demand comparison. You can use the calculated rate or override the rate. Any rate changes that you make are valid only for this scenario.
Note: The blended rate is for the supply and demand comparison for all roles and all regions. There is no blended rate by role.
Field or Control |
Description |
|---|---|
Recalculate |
Click to calculate estimated costs based on the selected rate. |
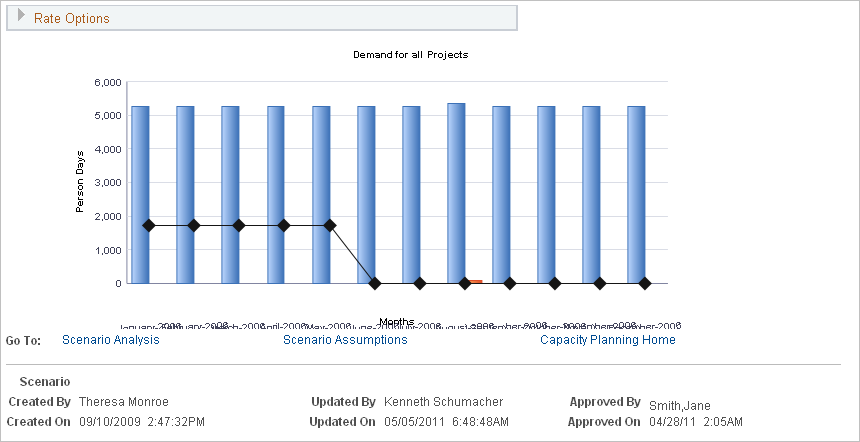
Demand for all Projects
This bar graph shows these three dimensions by month:
Forecasted Demand
Allocated Demand
Forecasted Supply
This data is an aggregate total for the entire supply and demand forecast. The y-axis represents the effort level in days or hours, and the x-axis represents monthly periods.
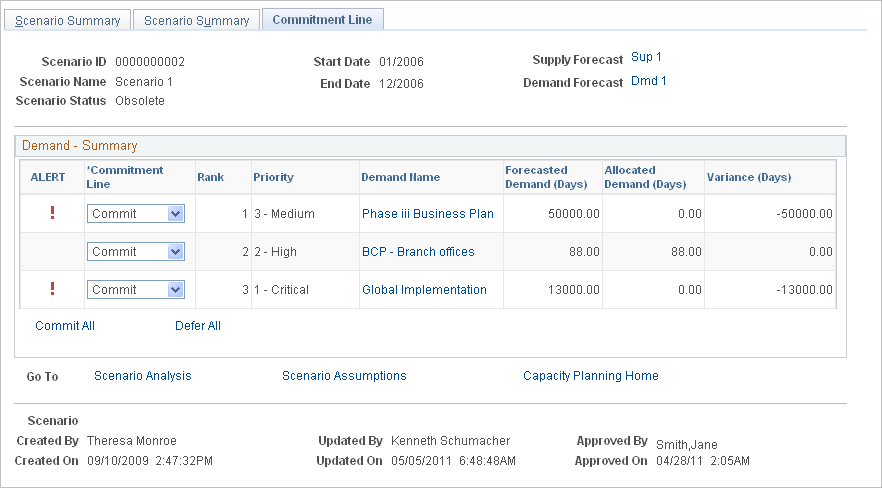
Use the Consolidated Scenario Analysis - Commitment Line page (RS_SCENARIO_DTL) to commit or defer the demand for a particular scenario.
Navigation:
This example illustrates the fields and controls on the Consolidated Scenario Analysis - Commitment Line page. You can find definitions for the fields and controls later on this page.
Field or Control |
Description |
|---|---|
|
Indicates that allocated demand is less than forecasted demand for the corresponding row. The variance appears as a negative value. |
Commitment Line |
Select an action to commit or defer the demand. Note: When you create a scenario, the system automatically commits all demand entries in the forecast and modifies allocated demand to match forecasted demand. However, if the value in this column is Defer and you change it to Commit, the system does not override the Allocated Demand field with the Forecasted Demand field value. The system does not assume that you are committing to all the forecasted demand—only what you manually enter for allocated demand. |
Rank |
Displays the sequential ranking that you assigned to the demand. |
Priority |
Displays the demand priority of Critical, High, Medium, or Low. |
Demand Name |
Displays the project or external demand description. Click a demand name to access the Consolidated Scenario Analysis - Demand Details page to modify the allocated and forecasted demand by role and month. |
Forecasted Demand |
Displays the total effort for the project in the demand forecast. This total is for the date range specified in the scenario forecasts only. |
Allocated Demand |
Displays the total demand effort that is set aside for this project. Initially, when the system commits to all demand by default, this field is automatically set to match the forecasted demand values for the corresponding row. Click a demand name to access the Consolidated Scenario Analysis - Demand Details page to modify the allocated demand. |
Variance |
Displays the difference of the allocated demand value minus the forecasted demand value for the corresponding row. The initial value is 0 since the system automatically commits to all demand. The system recalculates the value as you adjust forecasted or allocated demand. When the variance is a negative value, an ALERT icon appears at the beginning of the row. This indicates that allocated demand is less than forecasted demand for the corresponding row. |
Commit All and Defer All |
Click to change the value in the Commitment Line column to Commit or Defer for all rows. |
Save |
Click to save the scenario data and update the original supply and demand forecasts with the applicable changes. |
Approve |
Click to access the Consolidated Scenario Analysis - Assumptions page to log assumptions and approve the scenario. This action locks the consolidated scenario and the associated supply and demand forecasts. |
Scenario Analysis |
Click to access the Consolidated Scenario Analysis page and analyze consolidated scenario data by supply categories by month. |
Scenario Assumptions |
Click to access the Consolidated Scenario Analysis - Assumptions page and enter additional information about the scenario. |
Capacity Planning Home |
Click to access the Strategic Capacity Planning Home page to view and copy the five most recently accessed scenarios, supply forecasts, and demand forecasts. |

Use the Consolidated Scenario Analysis - Demand Details page (RS_SNR_DEMAND_DTL) to adjust forecasted and allocated demand and modify project header information.
Navigation:
Click the demand name link on the Consolidated Scenario Analysis - Commitment Line page.
This example illustrates the fields and controls on the Consolidated Scenario Analysis - Demand Details page. You can find definitions for the fields and controls later on this page.
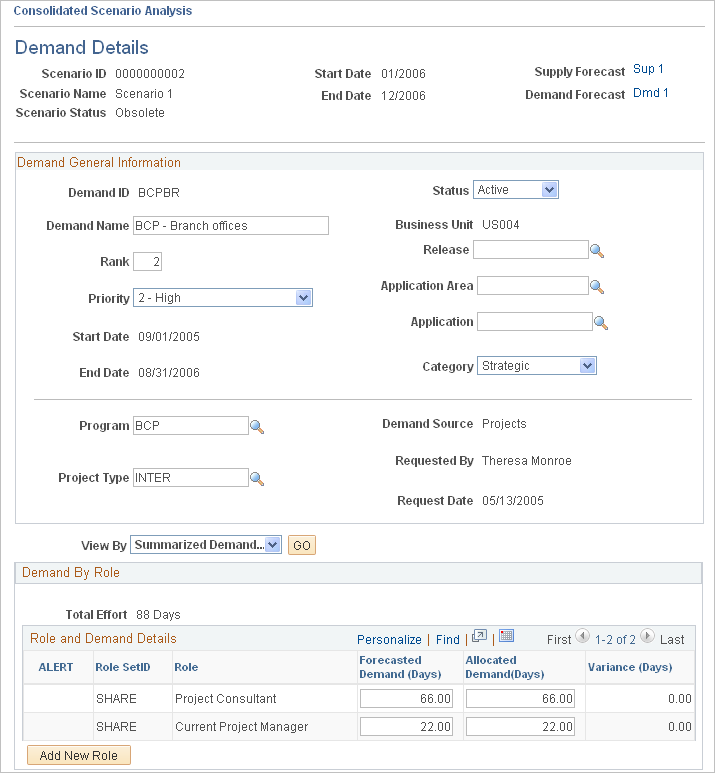
Demand General Information
In this group box, you can view information about the forecasted or allocated demand, and modify some of the demand attributes.
Note: Modifying information on this page does not modify the corresponding project.
Demand By Role
The columns that appear in this group box vary based on the View By selection. You can view the demand by <Month/Year>, All Months, or Summarized Demand.
Field or Control |
Description |
|---|---|
Forecasted Demand and Allocated Demand |
Enter new values as required. Since these rows display the effort by role and month, any modification changes the demand forecast data at the lowest level of the forecast. If you view the rows by Summarized Demand, changes that you make are spread across all months of the demand. Changes to the allocated demand on this page are reflected in the scenario on the Commitment Line page. The values for allocated demand are part of the scenario only and are not sourced from the initial demand forecast. |
Variance |
Displays allocated demand minus forecasted demand. |
View project details |
Click to access the Project Definitions - General Information page in a new page if the demand is associated with a project. If it is from an external demand, the View project details link is not available. |
Add New Role |
Click to access the Add New Role. New roles that are added at the summarized level are split evenly across the months in the scenario, for the Unassigned resource pool, with a blank personnel status. You view the role by month to enter the data more precisely. To delete a role, enter 0.00 in the fields for the row. Note: Because region is SetID-specific, if you add a role in either demand or supply in a consolidated scenario, the system uses the default region that is specified on the Installation Options - Resource Management page. It is recommended that you create regions under one SetID unless your resources are spread across multiple SetIDs. |
Click OK to return to the Consolidated Scenario Analysis - Commitment Line page. The updated demand summary data is reflected on the page.
Use the Consolidated Scenario Analysis - Supply Details page (RS_SNR_SUPPLY) to modified the supply forecast and view over-allocated roles.
Navigation:
Click Modify Supply on the Consolidated Scenario Analysis - Scenario Summary page.
Note: You can modify the overall forecasted supply level for the role without drilling down to the region level to adjust supply. Any change to the supply is automatically allocated to the region that is defined on the Installation Options - Resource Management page, and to the Unassigned resource pool. You can adjust supply for each role at the region level by clicking the role link.
Field or Control |
Description |
|---|---|
Role |
Click a link in this column to access the Consolidated Scenario Analysis - Edit Supply By Region page and adjust forecasted supply by region. |
View By |
When you first access this page, the Supply group box displays the summary of all months in the scenario date range. You can change the view by selecting one of these values and clicking the Go button:
|
|
An ALERT icon appears when the variance is negative. The icon is visible regardless of the View By selection; however, if you select a specific individual month, the system verifies whether that particular month has a negative variance. The ALERT icon does not appear if a role is over-allocated overall, but is not over-allocated in the specific month being viewed. |
Forecasted Supply |
Displays the total capacity forecasted for the current month by role for all regions. Changing data on this page does not specify the region for which capacity is being changed; therefore, the system places any additional capacity into the default region specified on the Installation Options - Resource Management page. The system also places negative changes—changes in which you decrease capacity—into the default region with a negative modifier, such as −100 if you change a value from 500 to 400. Any Summarized Supply data changes at this level are divided among all of the months in the scenario date range in the default region. For data changes made at the <Month/Year> level, the system updates only the specific month in the default region. |

Use the Consolidated Scenario Analysis - Scenario Summary (approve) page (RS_SCENARIO_SUMM) to View supply summaries and supply and demand metrics with graphical comparison.
Navigation:
Click the Approve button to approve the scenario.
The Consolidated Scenario Analysis - Assumptions page appears so that you can enter any assumptions that assisted in approving the scenario.
Note: Owner information that you enter on the Consolidated Scenario Analysis - Assumptions page is not used for workflow.
Users with security to unapprove scenarios have access to the Unapprove button on the Consolidated Scenario Analysis - Scenario Summary (unapprove) page. Click the Unapprove button to return the consolidated scenario, and the associated supply and demand forecasts, to an editable format.
Note: Approving a consolidated scenario does not trigger workflow, nor does it affect the projects or resources in the system. Approving a consolidated scenario simply locks the scenario and the associated supply and demand forecasts.
This example illustrates the fields and controls on the Consolidated Scenario Analysis page.
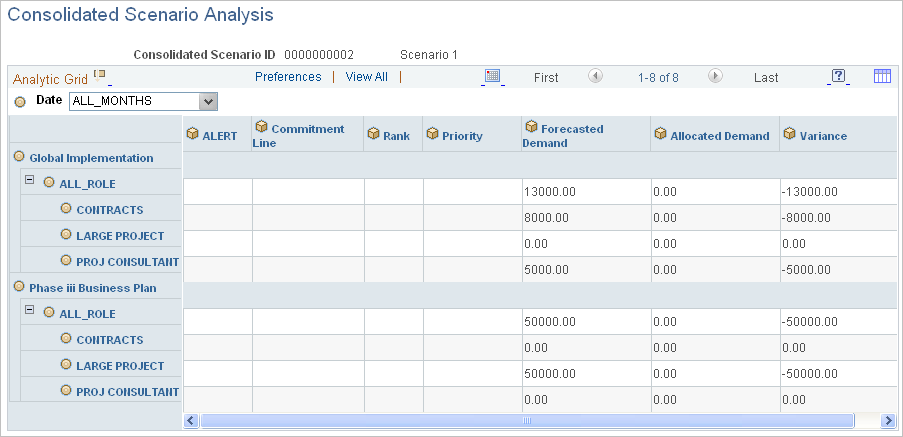
This page behaves similarly to the Supply Analysis page and Demand Analysis page, except that you analyze the data by using these categories:
Alert
Commitment Line
Allocated Demand
Rank
Priority
Forecasted Demand
Variance
See the product documentation for PeopleTools: Analytic Calculation Engine